There are thousands of available homes on MLS that may be perfect for you! Include your name and email address below to receive your custom list of new available homes in your desired neighbourhoods each morning. You will often receive new listings before they appear on other sites such as REALTOR.ca, giving you a head start with your search.

In some ways the July resale market’s performance was anticlimactic. We could see it unfolding in June, and as a result, there were few surprises. Sales continued their decline – in June 11,106 properties were reported sold, dropping to 9,390 in July, but still a strong month by historical standards. The record for reported sales was established last July at 11,081. At the end of the day there are only so many buyers in our given geographical area, and since the beginning of 2021, almost 80,000 properties have changed hands, a pace that will see at least 120,000 sales take place by the end of the year, shattering the previous record of 113,400 sales achieved in 2016.
All market indicators continue to point to a very robust market. The market’s slow down is due to absorption, seasonal change, and with higher vaccination rates and declining social restrictions consumers are focusing on activities other than buying and selling real estate. In addition, even if there was no change in buyers’ attitudes, there simply isn’t enough inventory in the marketplace. In July only 12,551 properties came to market, 31 percent fewer than the number that came to in market last July. As we enter August there are only 9,732 properties available for sale in the entire greater Toronto area, more than 35 percent less than were available last year (15,018).
The sales that took place were at lightning speed. In July all 9,390 reported sales took place (on average) in only 15 days. Last July, which was a record-breaking month, they took place in 17 days. These sales also came in at record-breaking average sale prices. In July the average sale price for all properties sold was $1,062,256,12.6 percent higher than last July’s average sale price ($943,594).
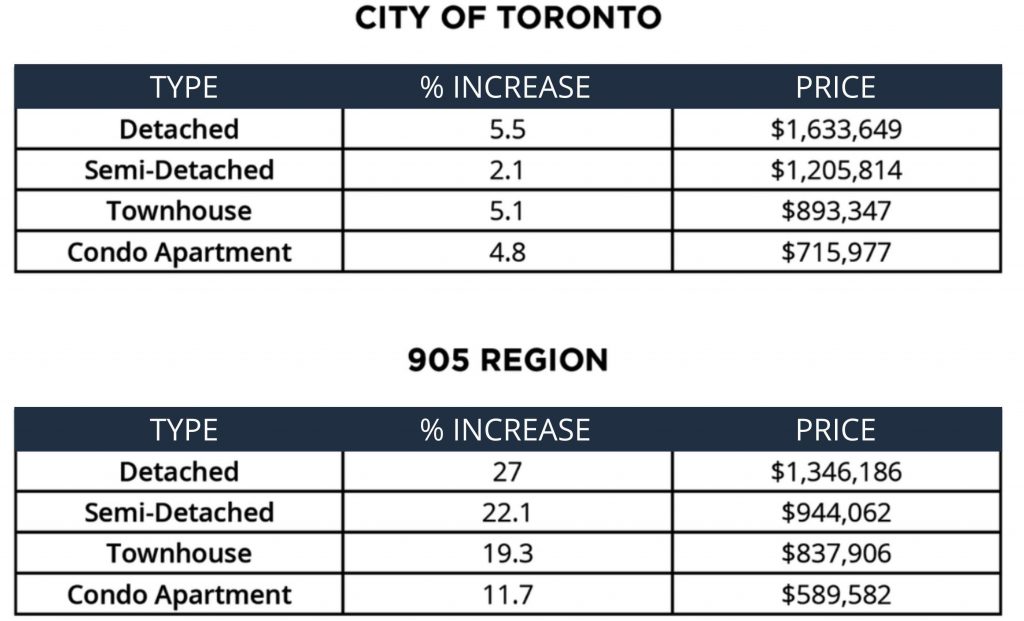
A closer examination of July’s average sale price indicates the growth in sale prices is taking place in Toronto’s 905 region, and very moderate price growth in the City of Toronto, as the chart below clearly indicates, the reason for this dramatic differentiation is twofold.

Firstly, prices for homes in the 905 region are substantially lower than in the City of Toronto. Affordability is very much at play in the decision-making of buyers. Secondly, the need and desire for more space and perceived more safety, continues to drive buyers away from dense areas in Toronto to the less crowded suburbs. Of the 9,390 reported sales in July, 6,121 traded in the 905 region, or more than 65 percent. This trend is not likely to end soon.
Overall, the high end of the market continues to perform very strongly. In July 521 properties having a sale price of $2 Million or more were reported sold. Last year only 452 properties were sold in this category of homes. It is amazing to look back to 2019. In that year only 185 properties were bought and sold having a sale price of $2 Million or more. In just two years the number of high-end properties sold has increased by an eye-popping 182 percent.
Condominium apartment sales have continued to strengthen over the last few months, particularly in the City of Toronto, where the availability of most condominium apartments is located. In fact, in July condominium apartments were the only housing type that saw year-over-year growth, with detached, semi-detached, and townhouse sales all producing negative variances compared to July of last year. Condominium apartment sales were up by 4.2 percent.
July saw the first overall negative variance in sales in 12 months. Again, it must be remembered that reported sales in July 2020 were record-breaking. Last July 11,033 properties were sold, this year 9,390. July was the fourth straight month of declining sales, which as discussed in our June market report, was anticipated, for reasons already stated – absorption, affordability, lack of supply, and historic seasonal adjustment. Early indications are that this trajectory will continue into August, and for the same reasons. Last August 10,738 residential resale properties were reported sold. This August we will see close to 8,500 properties trading hands. This does not mean that the market is softening. In 2019, which was a solid resale year, 7,682 properties were reported sold. What we are witnessing is the resale market slowly morphing back to pre-pandemic patterns.
Prepared by Chris Kapches, LLB, President and CEO, Broker, Chestnut Park® Real Estate Limited, Brokerage.
Have questions about the market or selling or buying?
Contact me any time. I’m happy to answer any questions you may have.

