
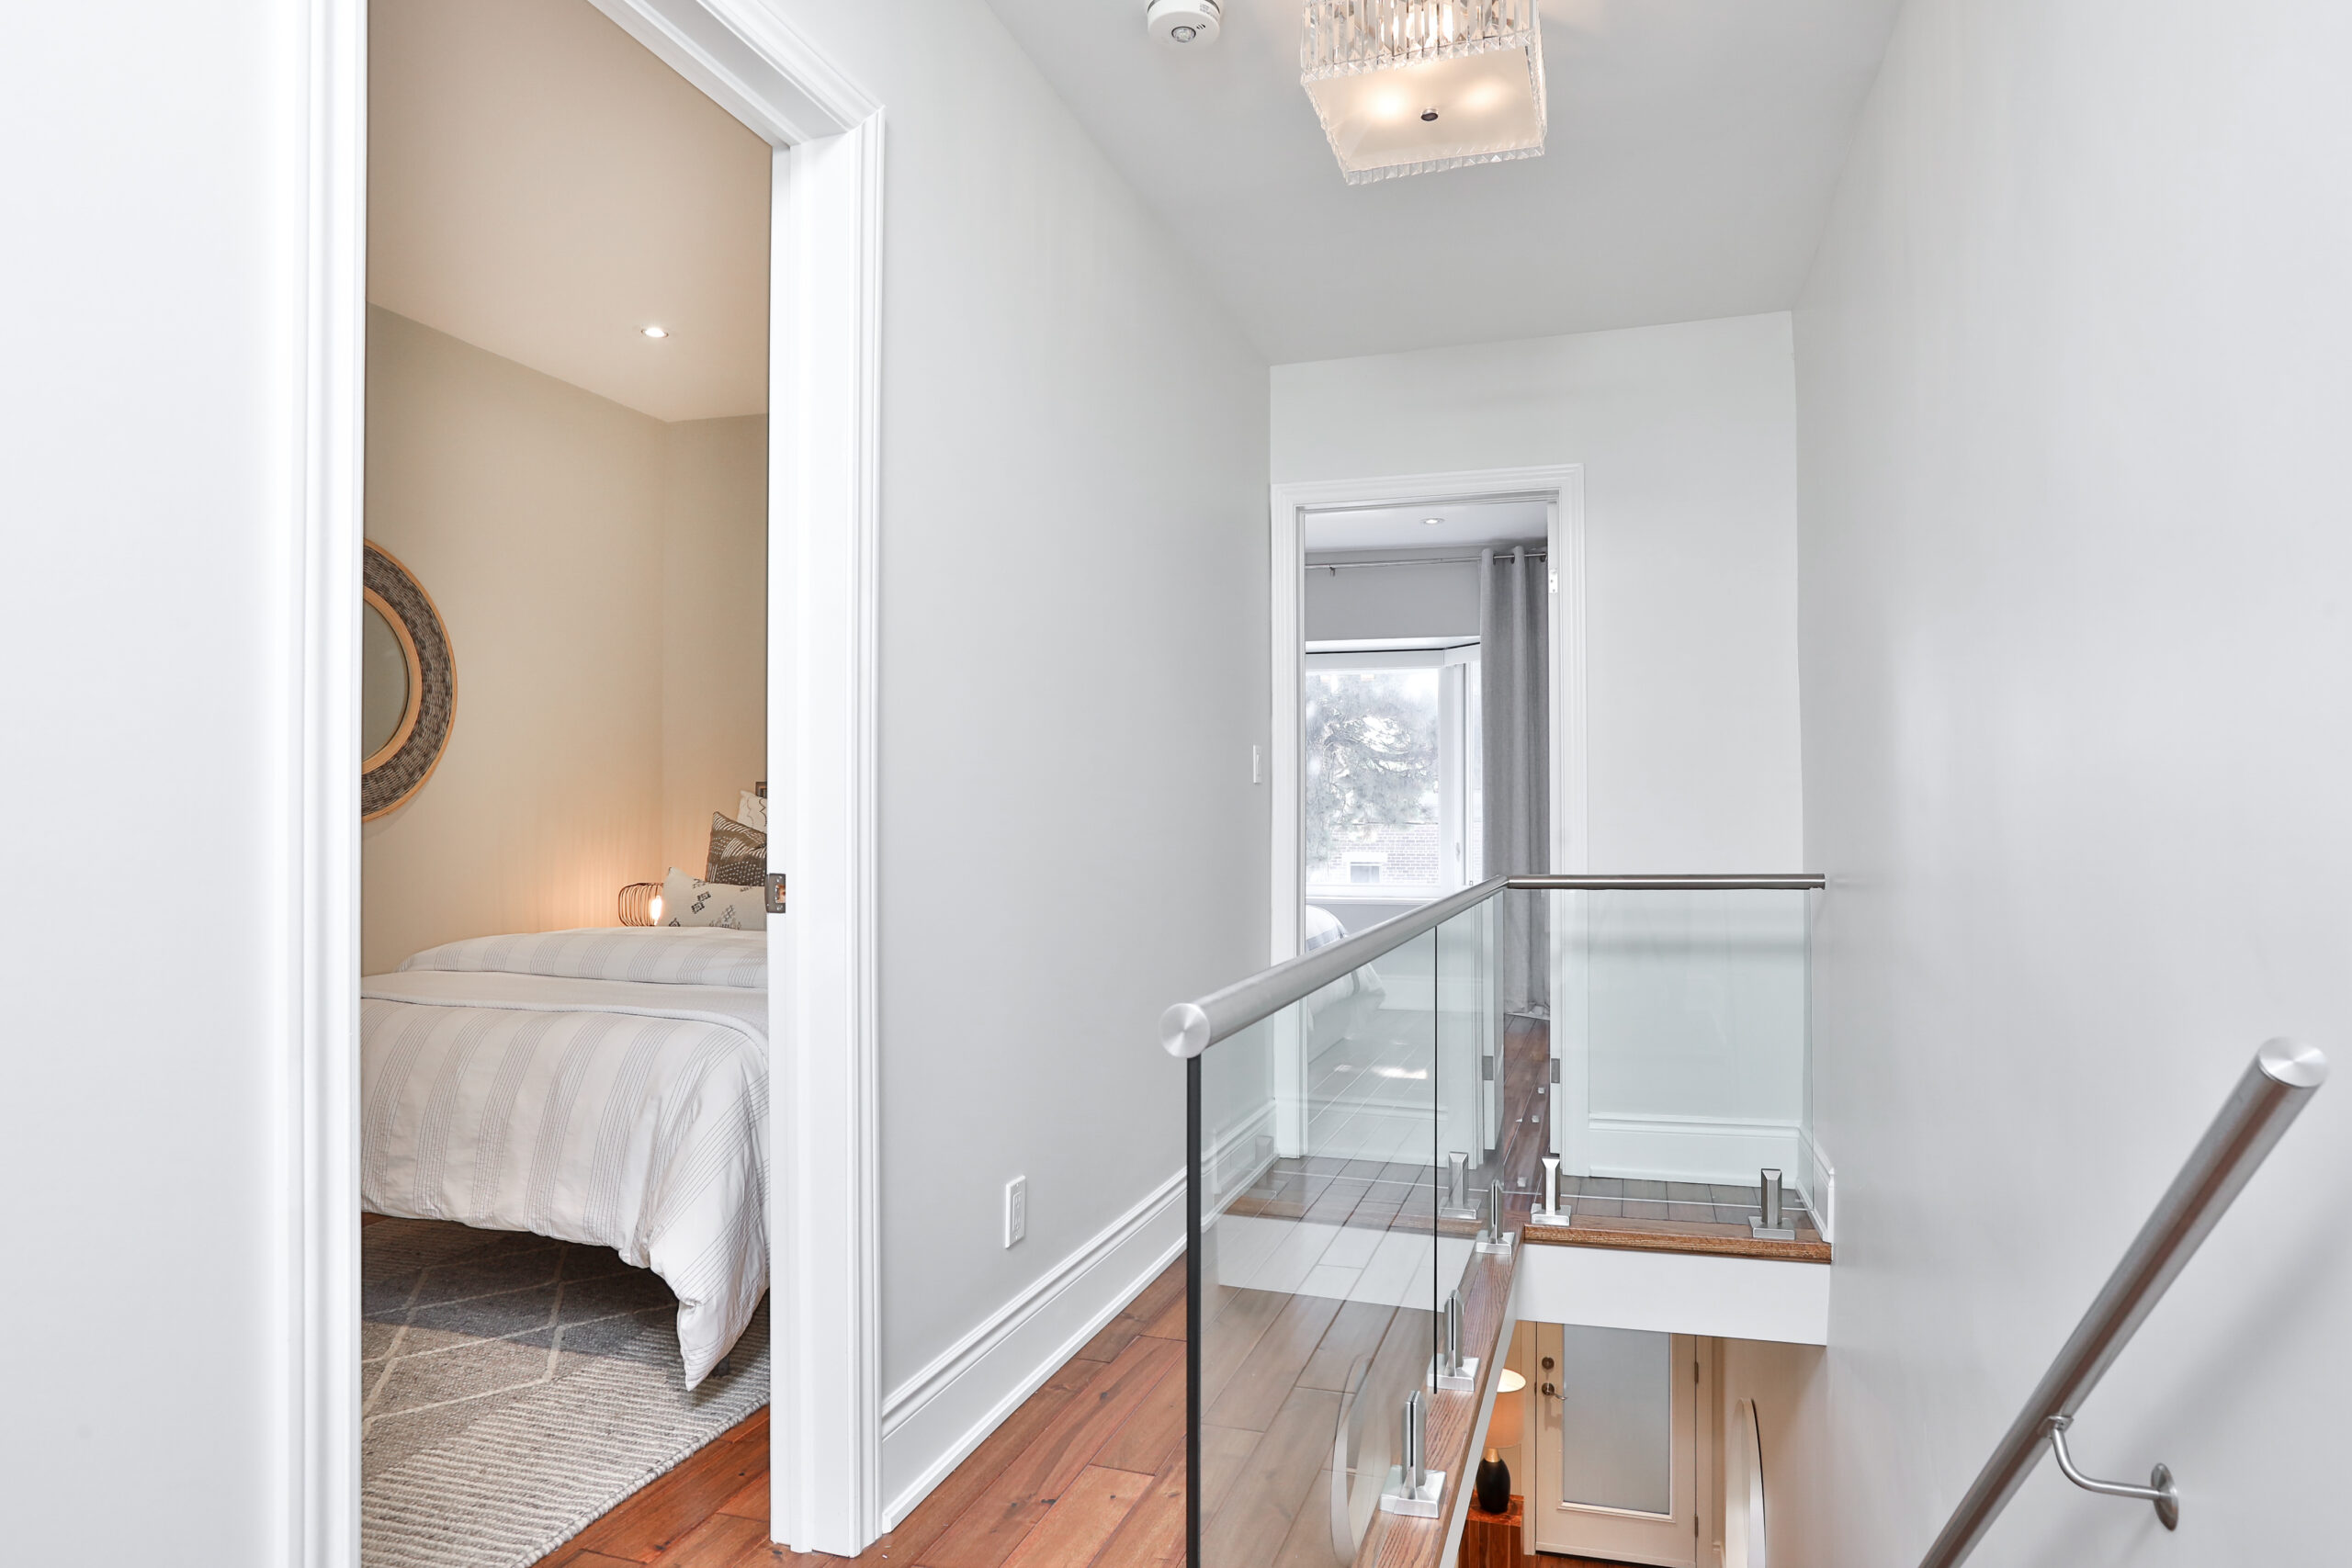
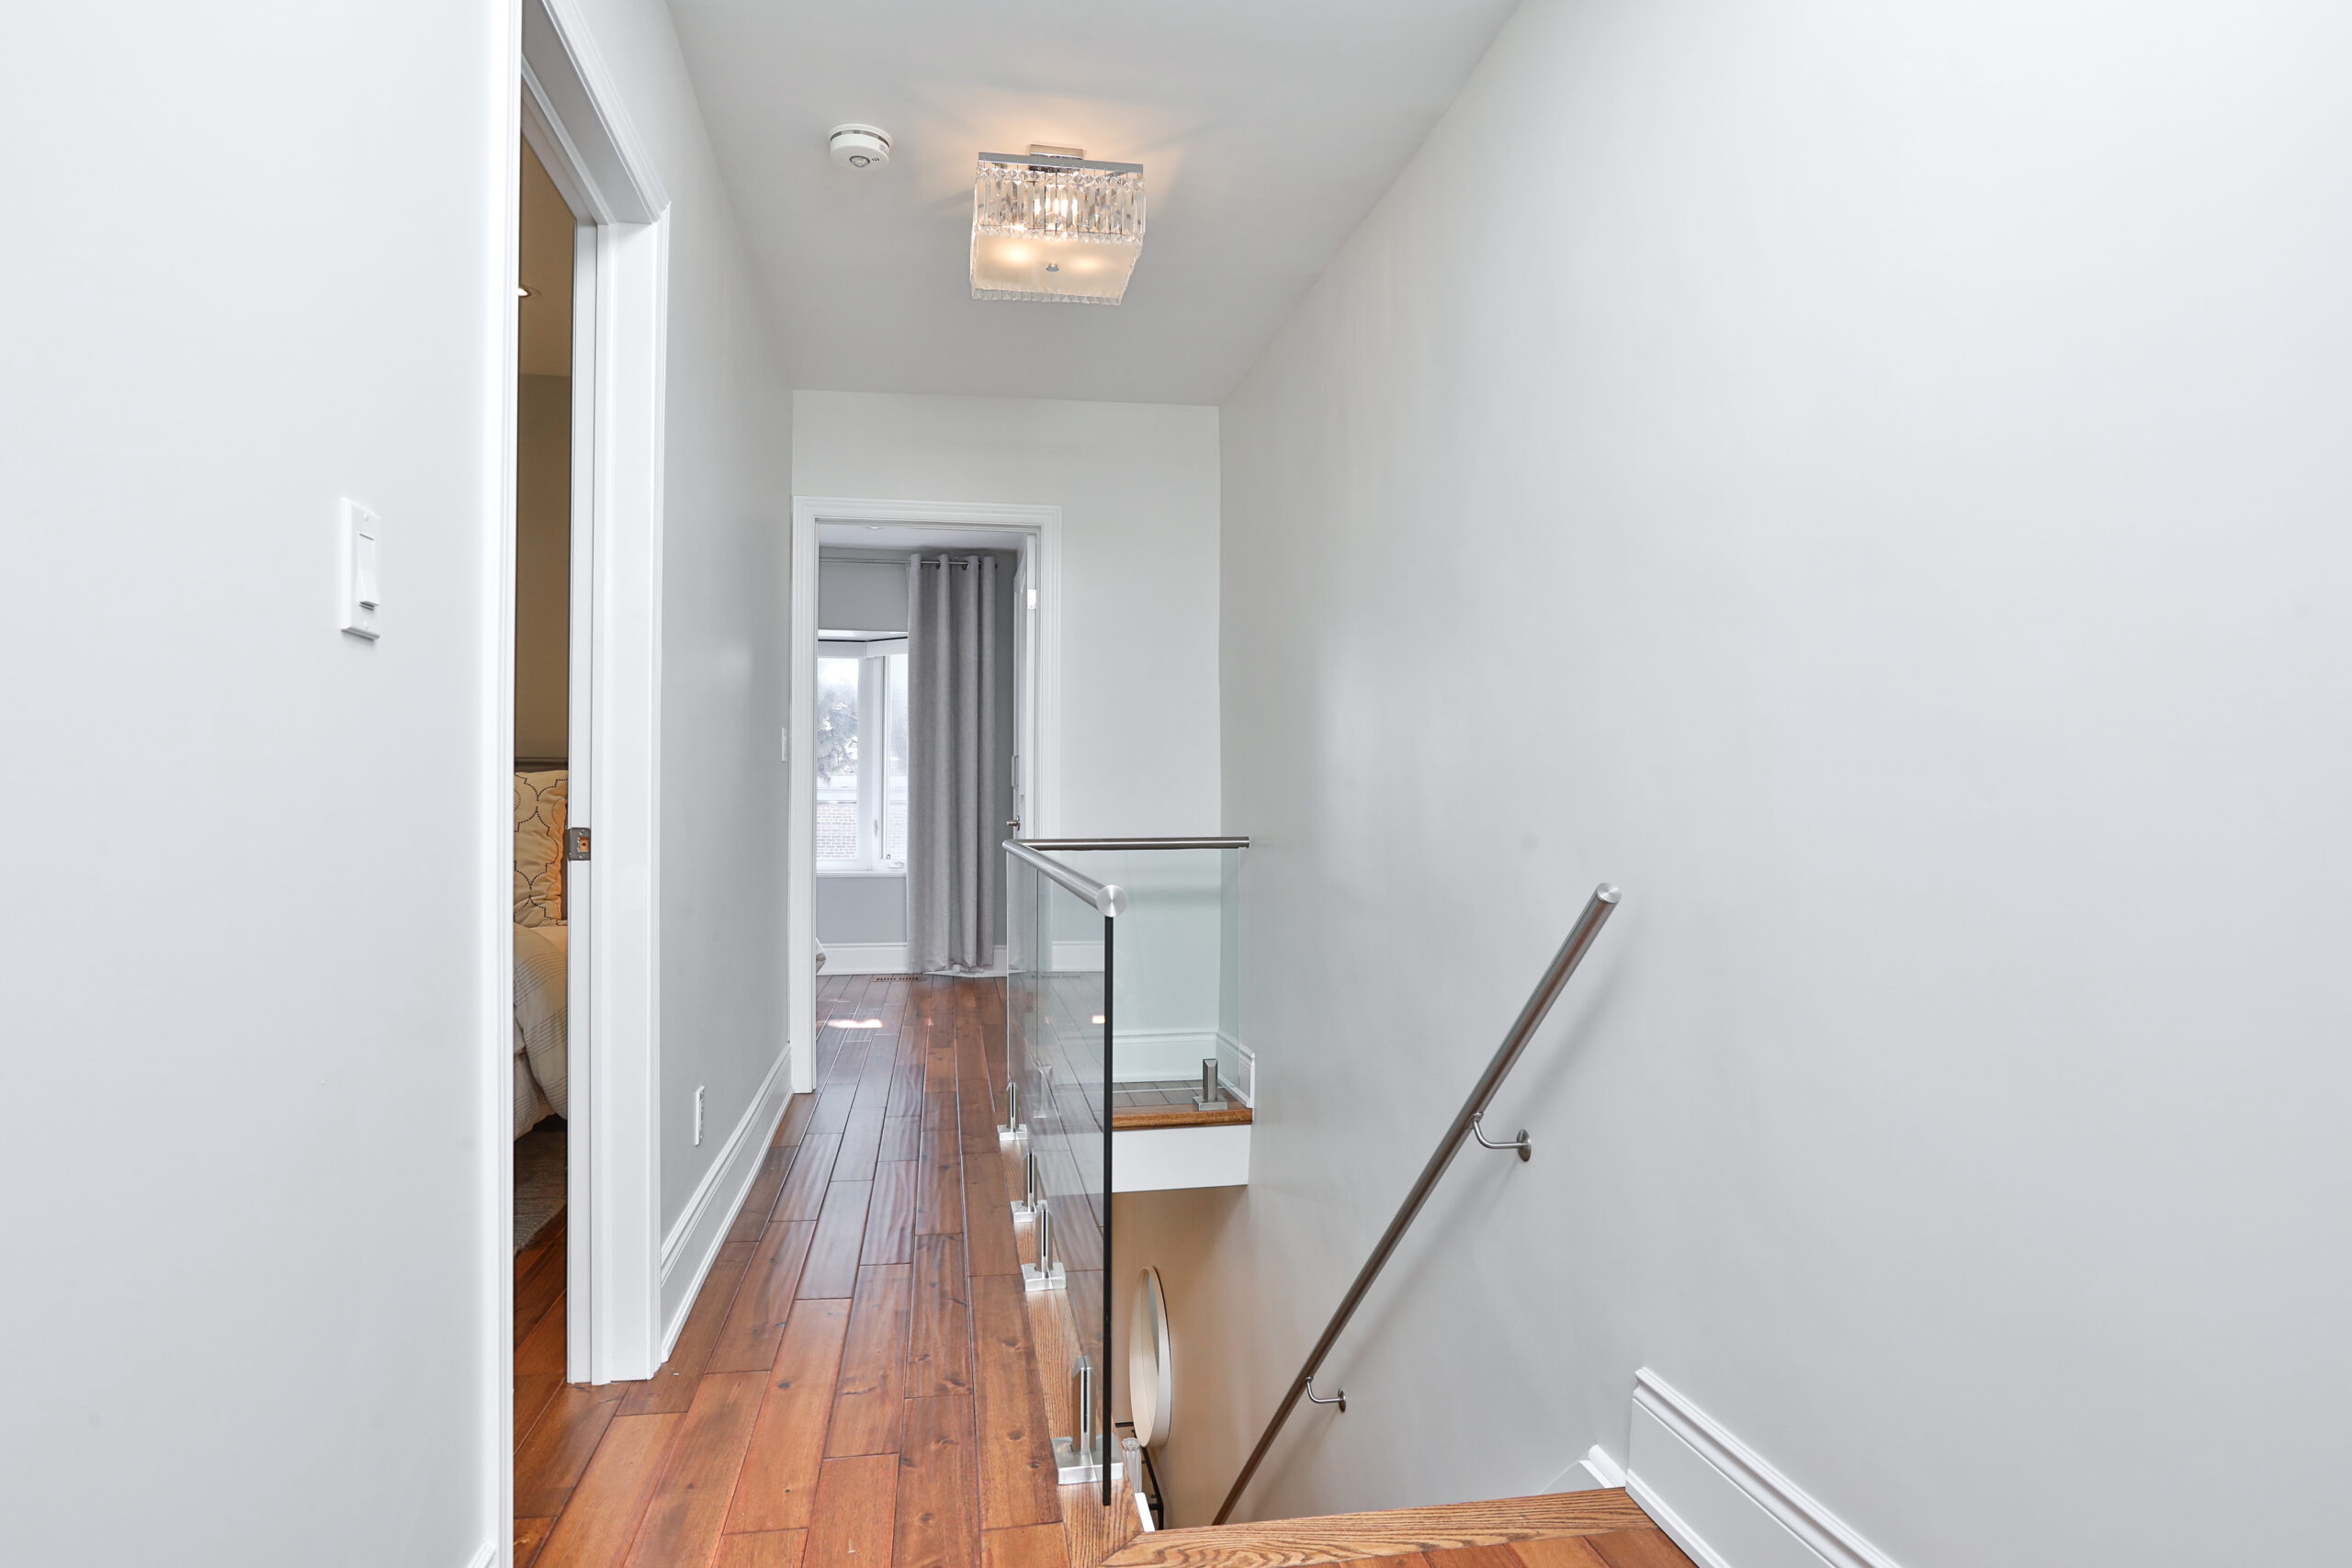
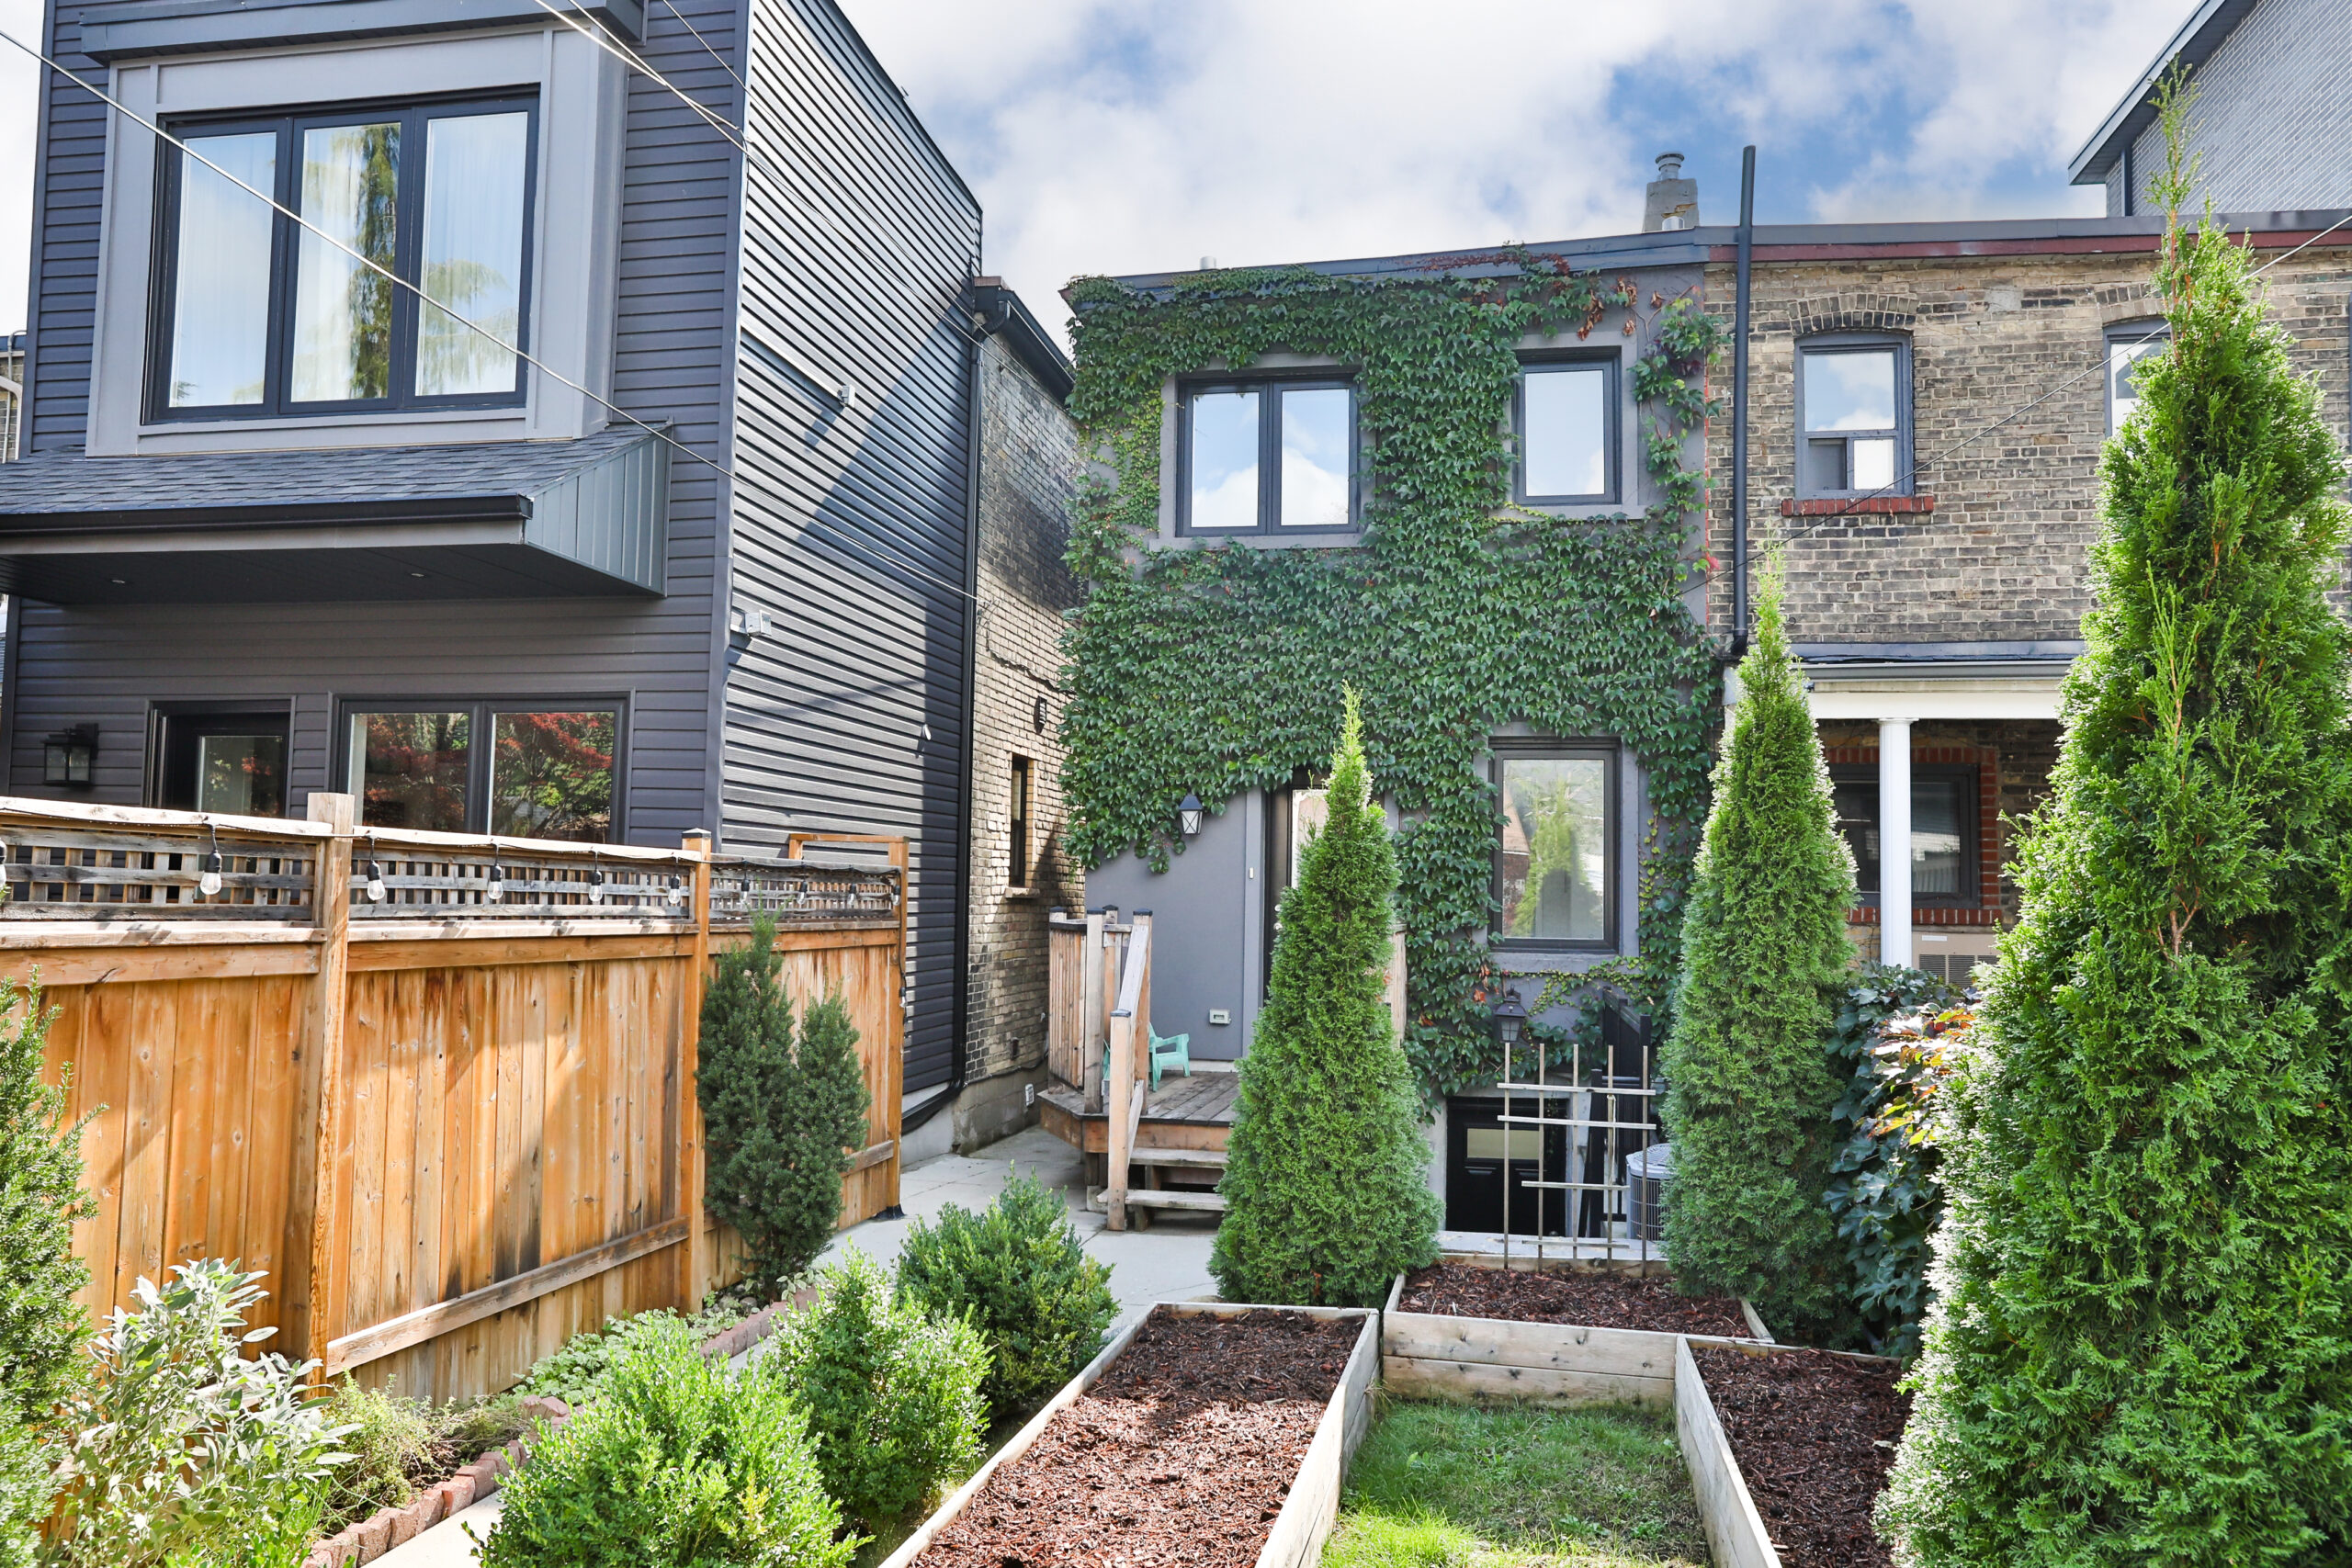
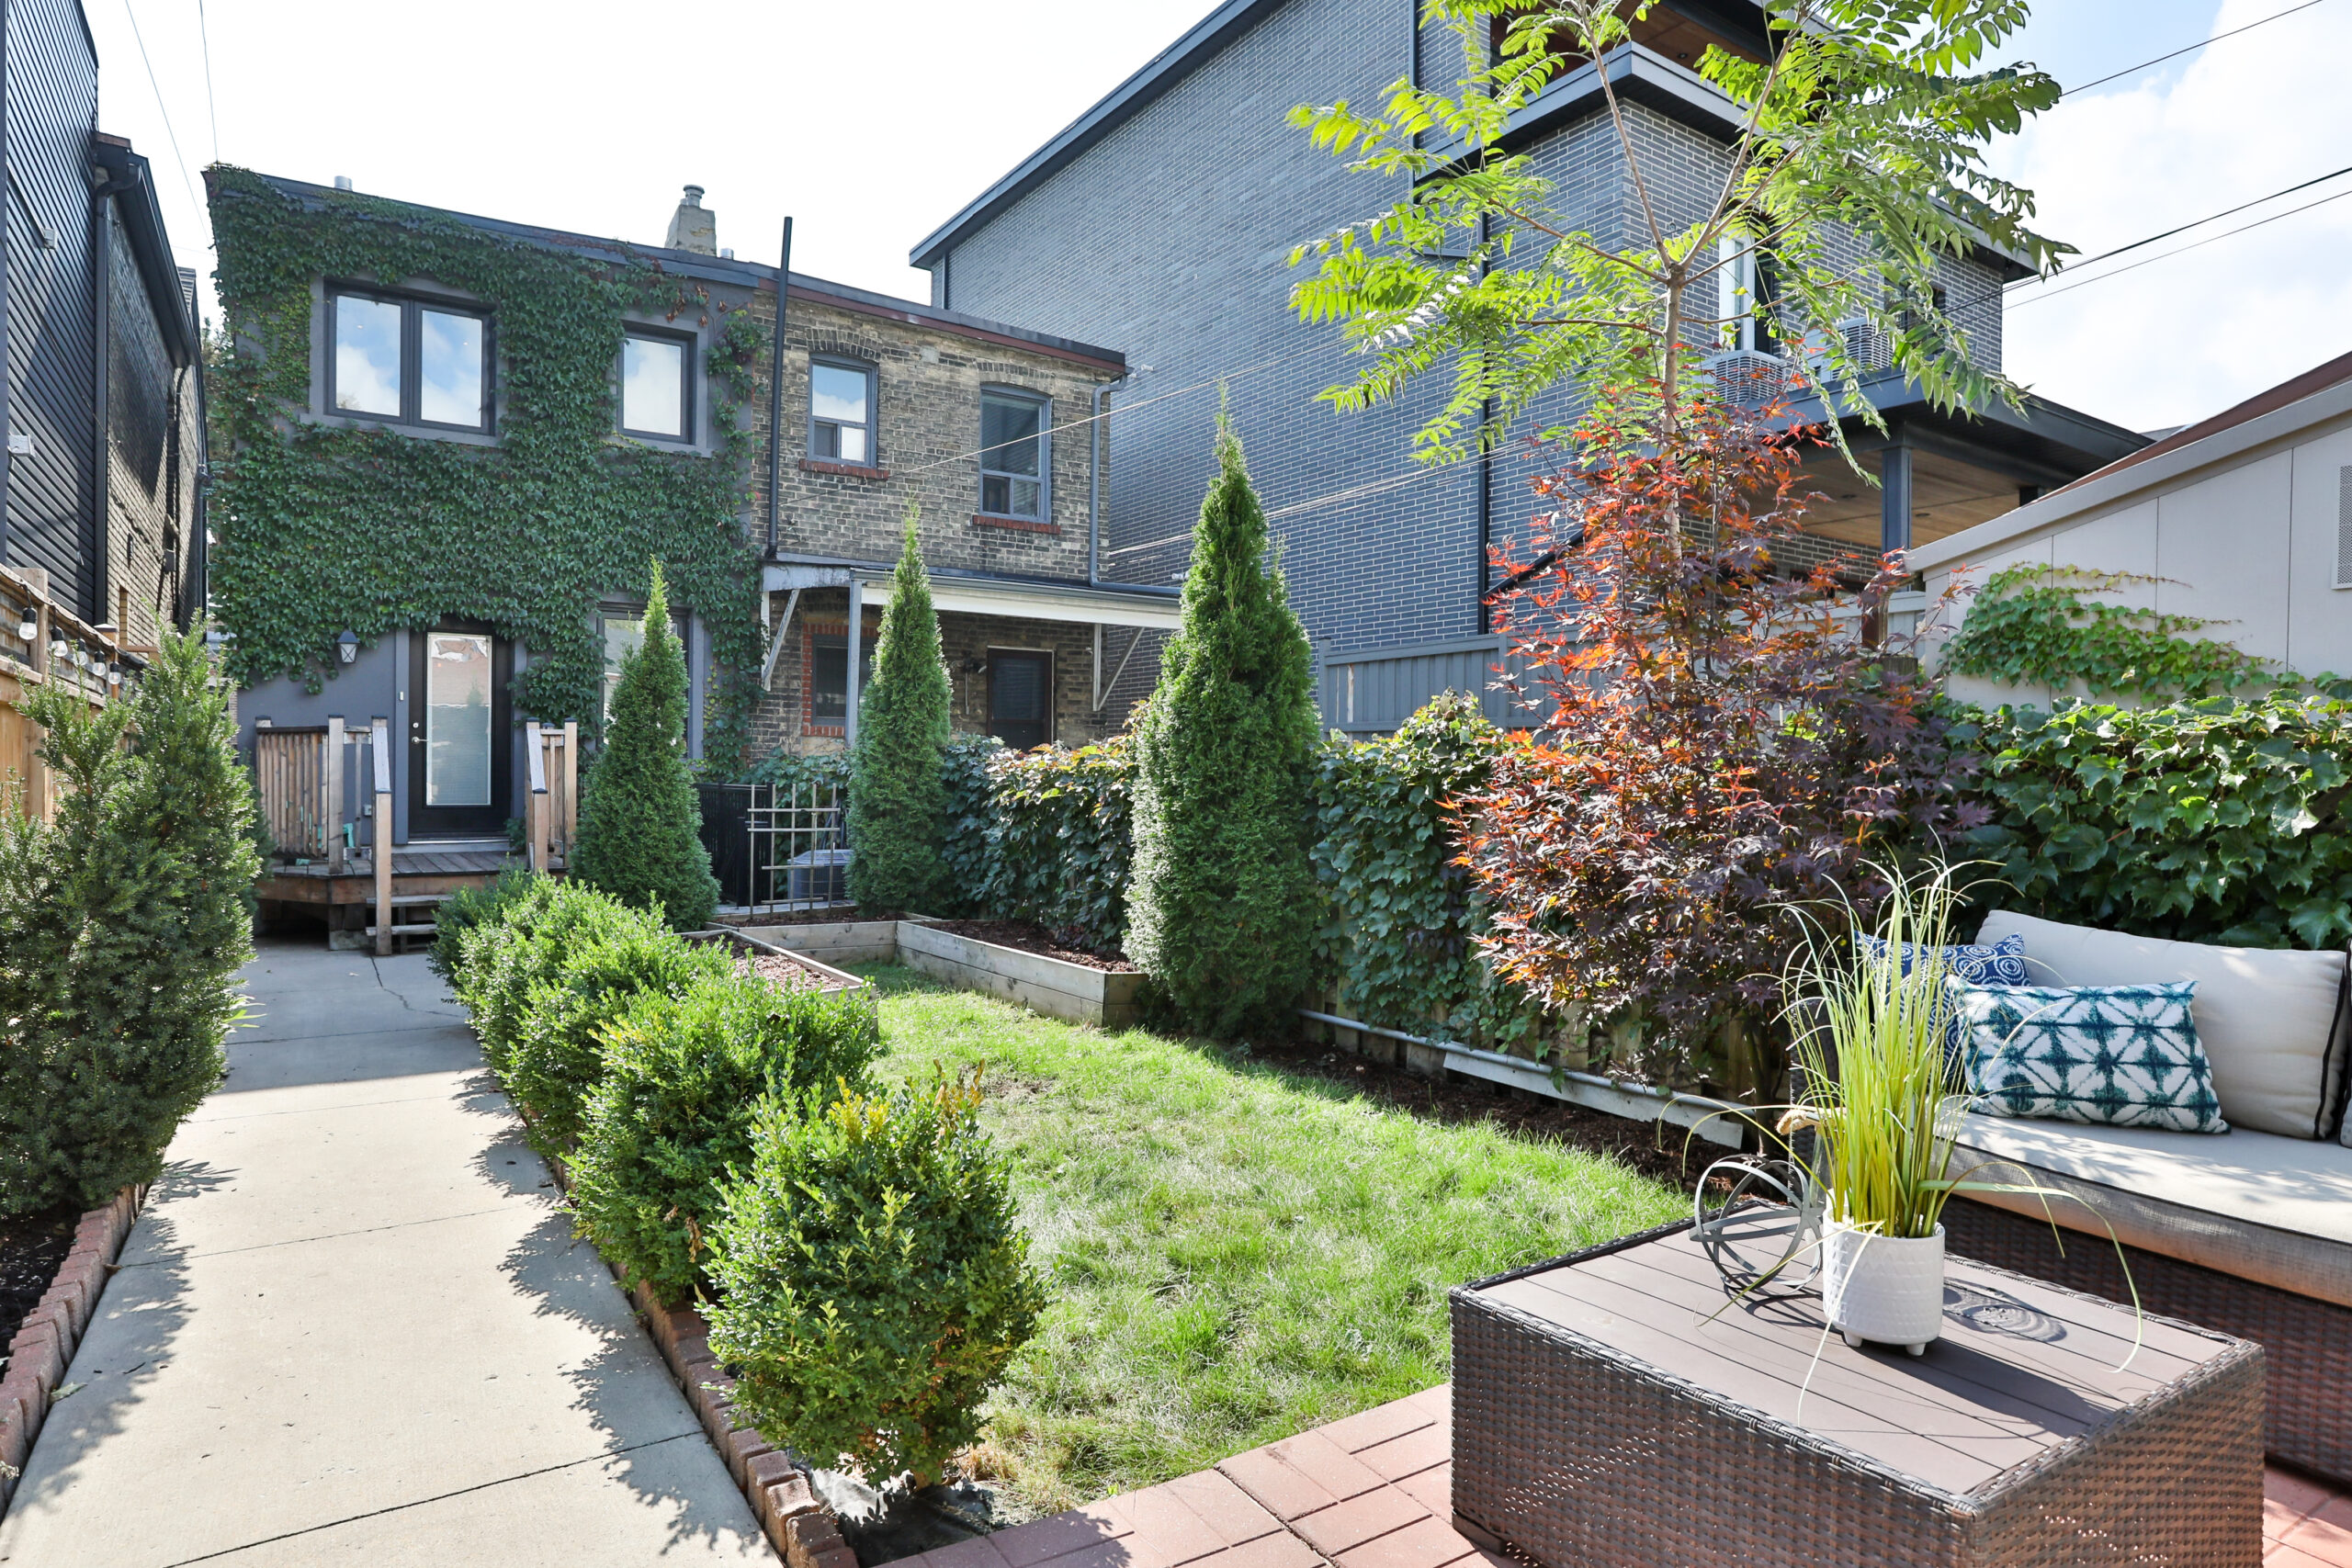
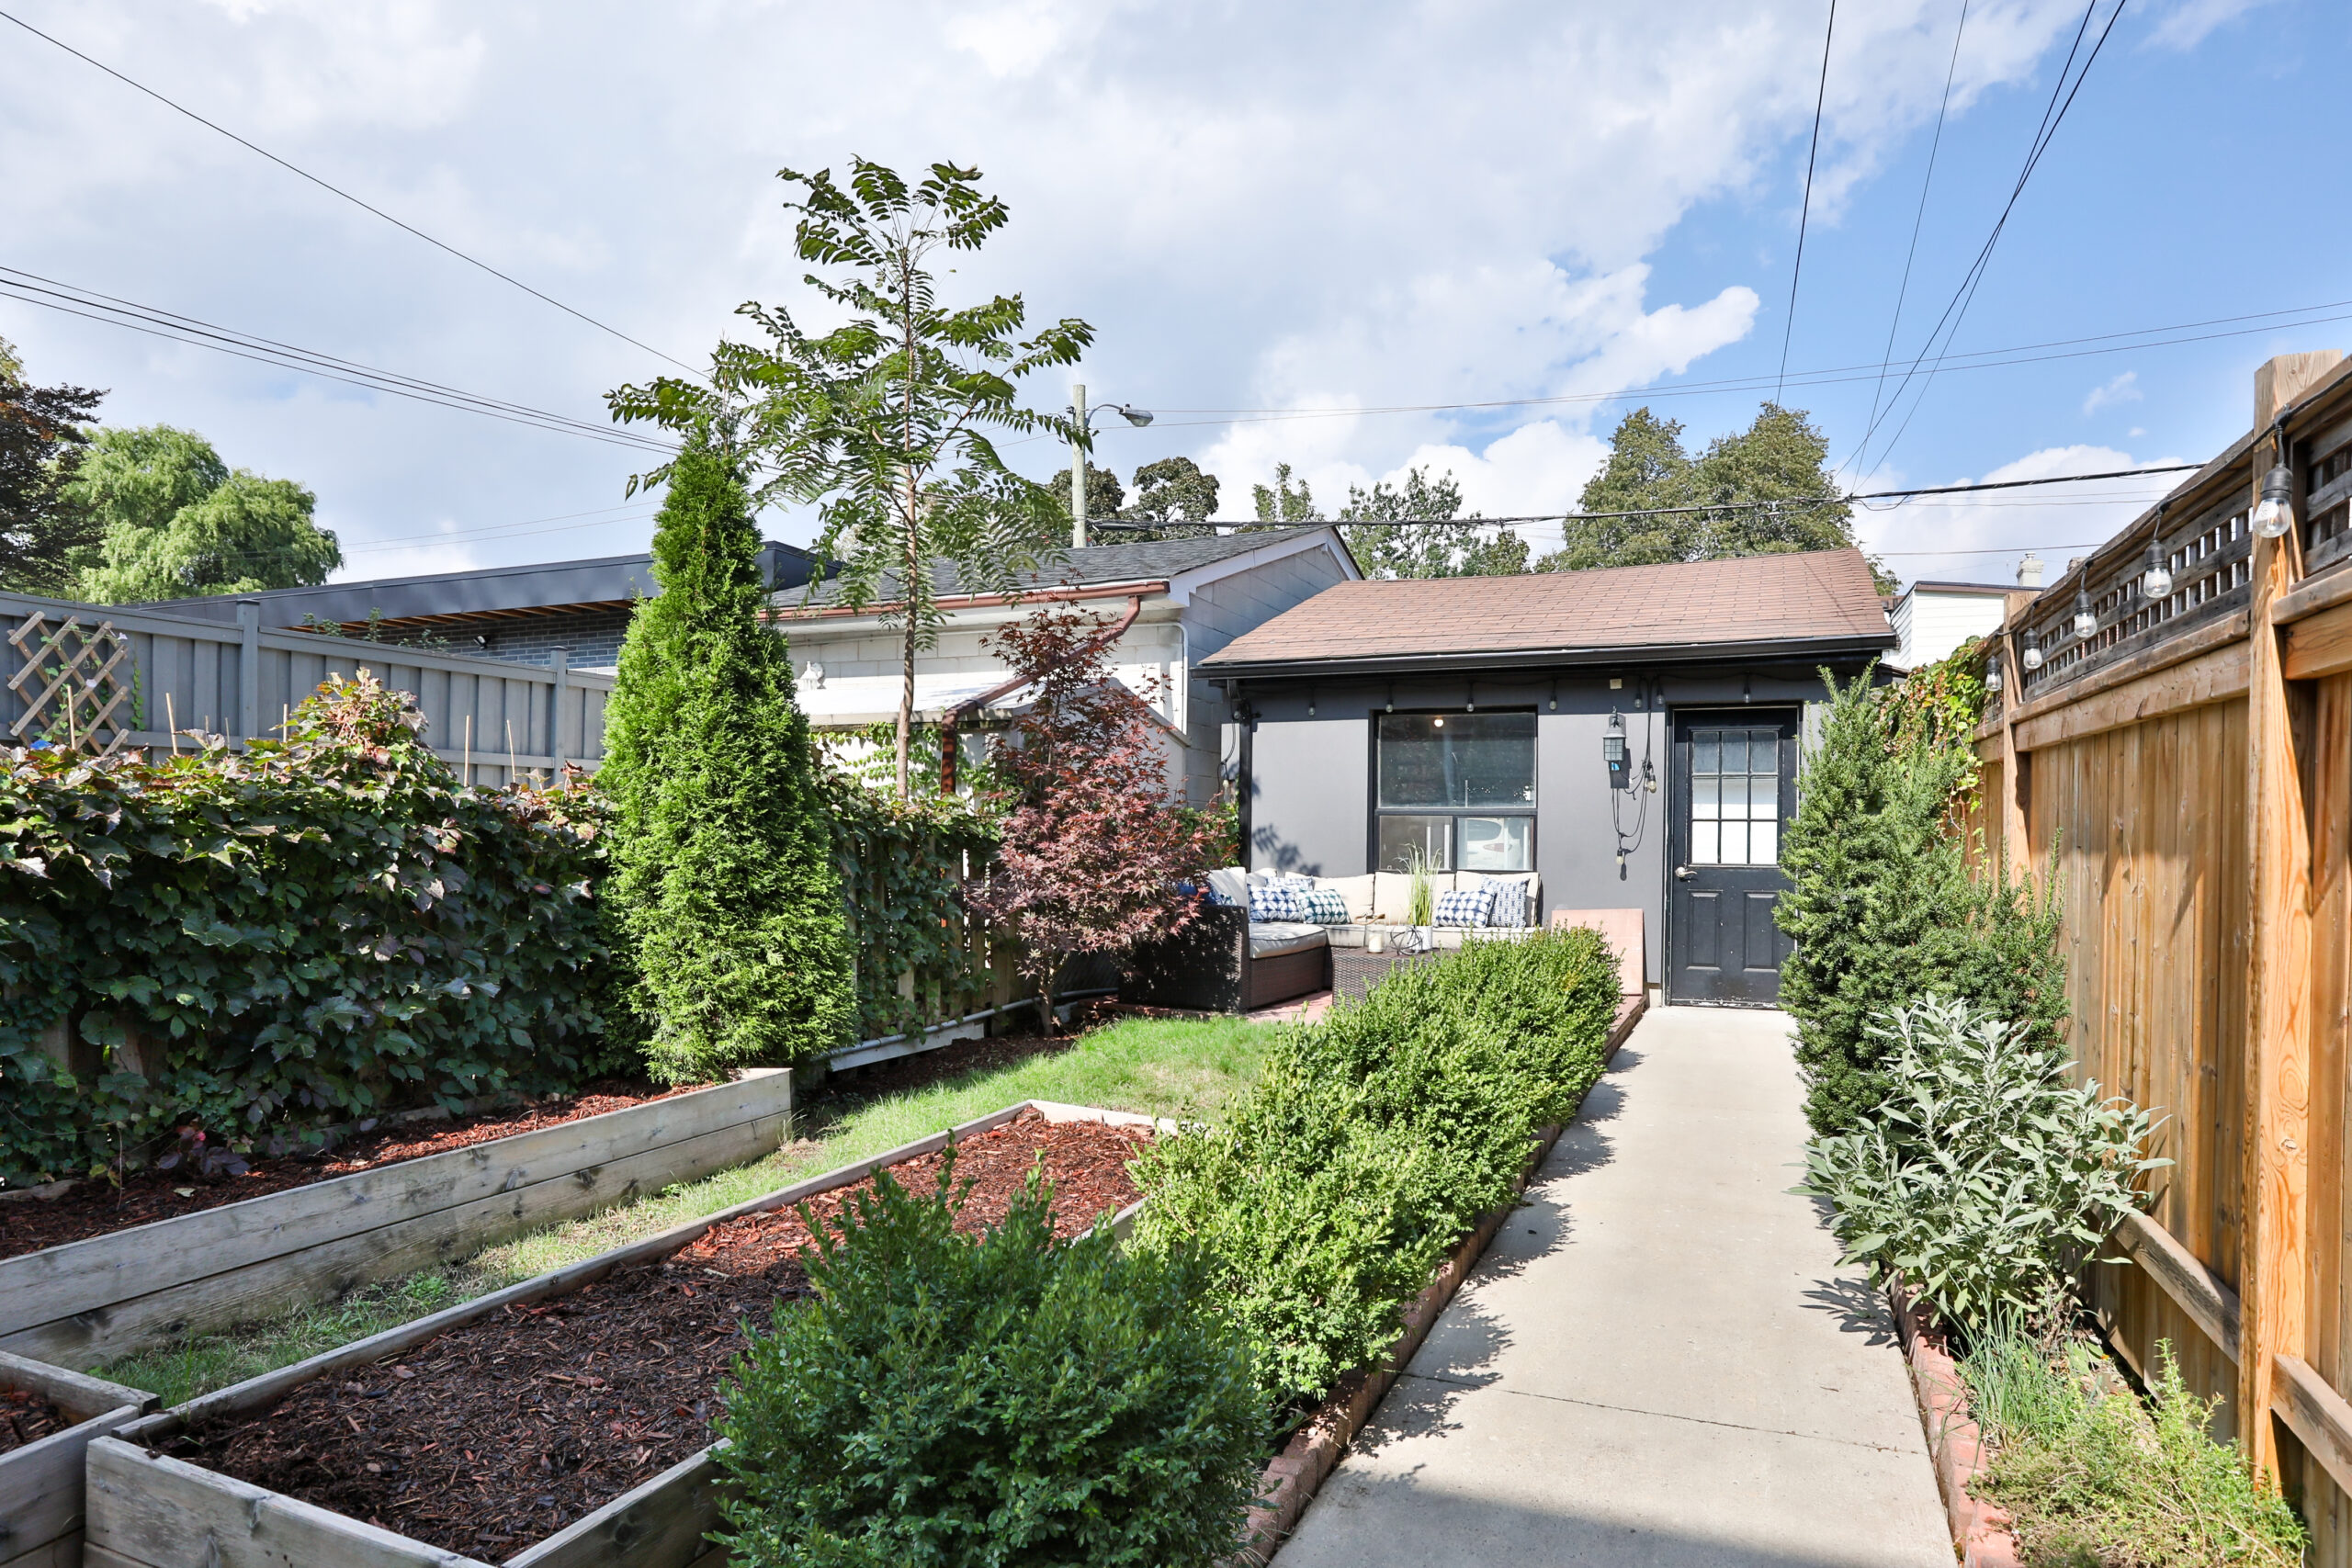
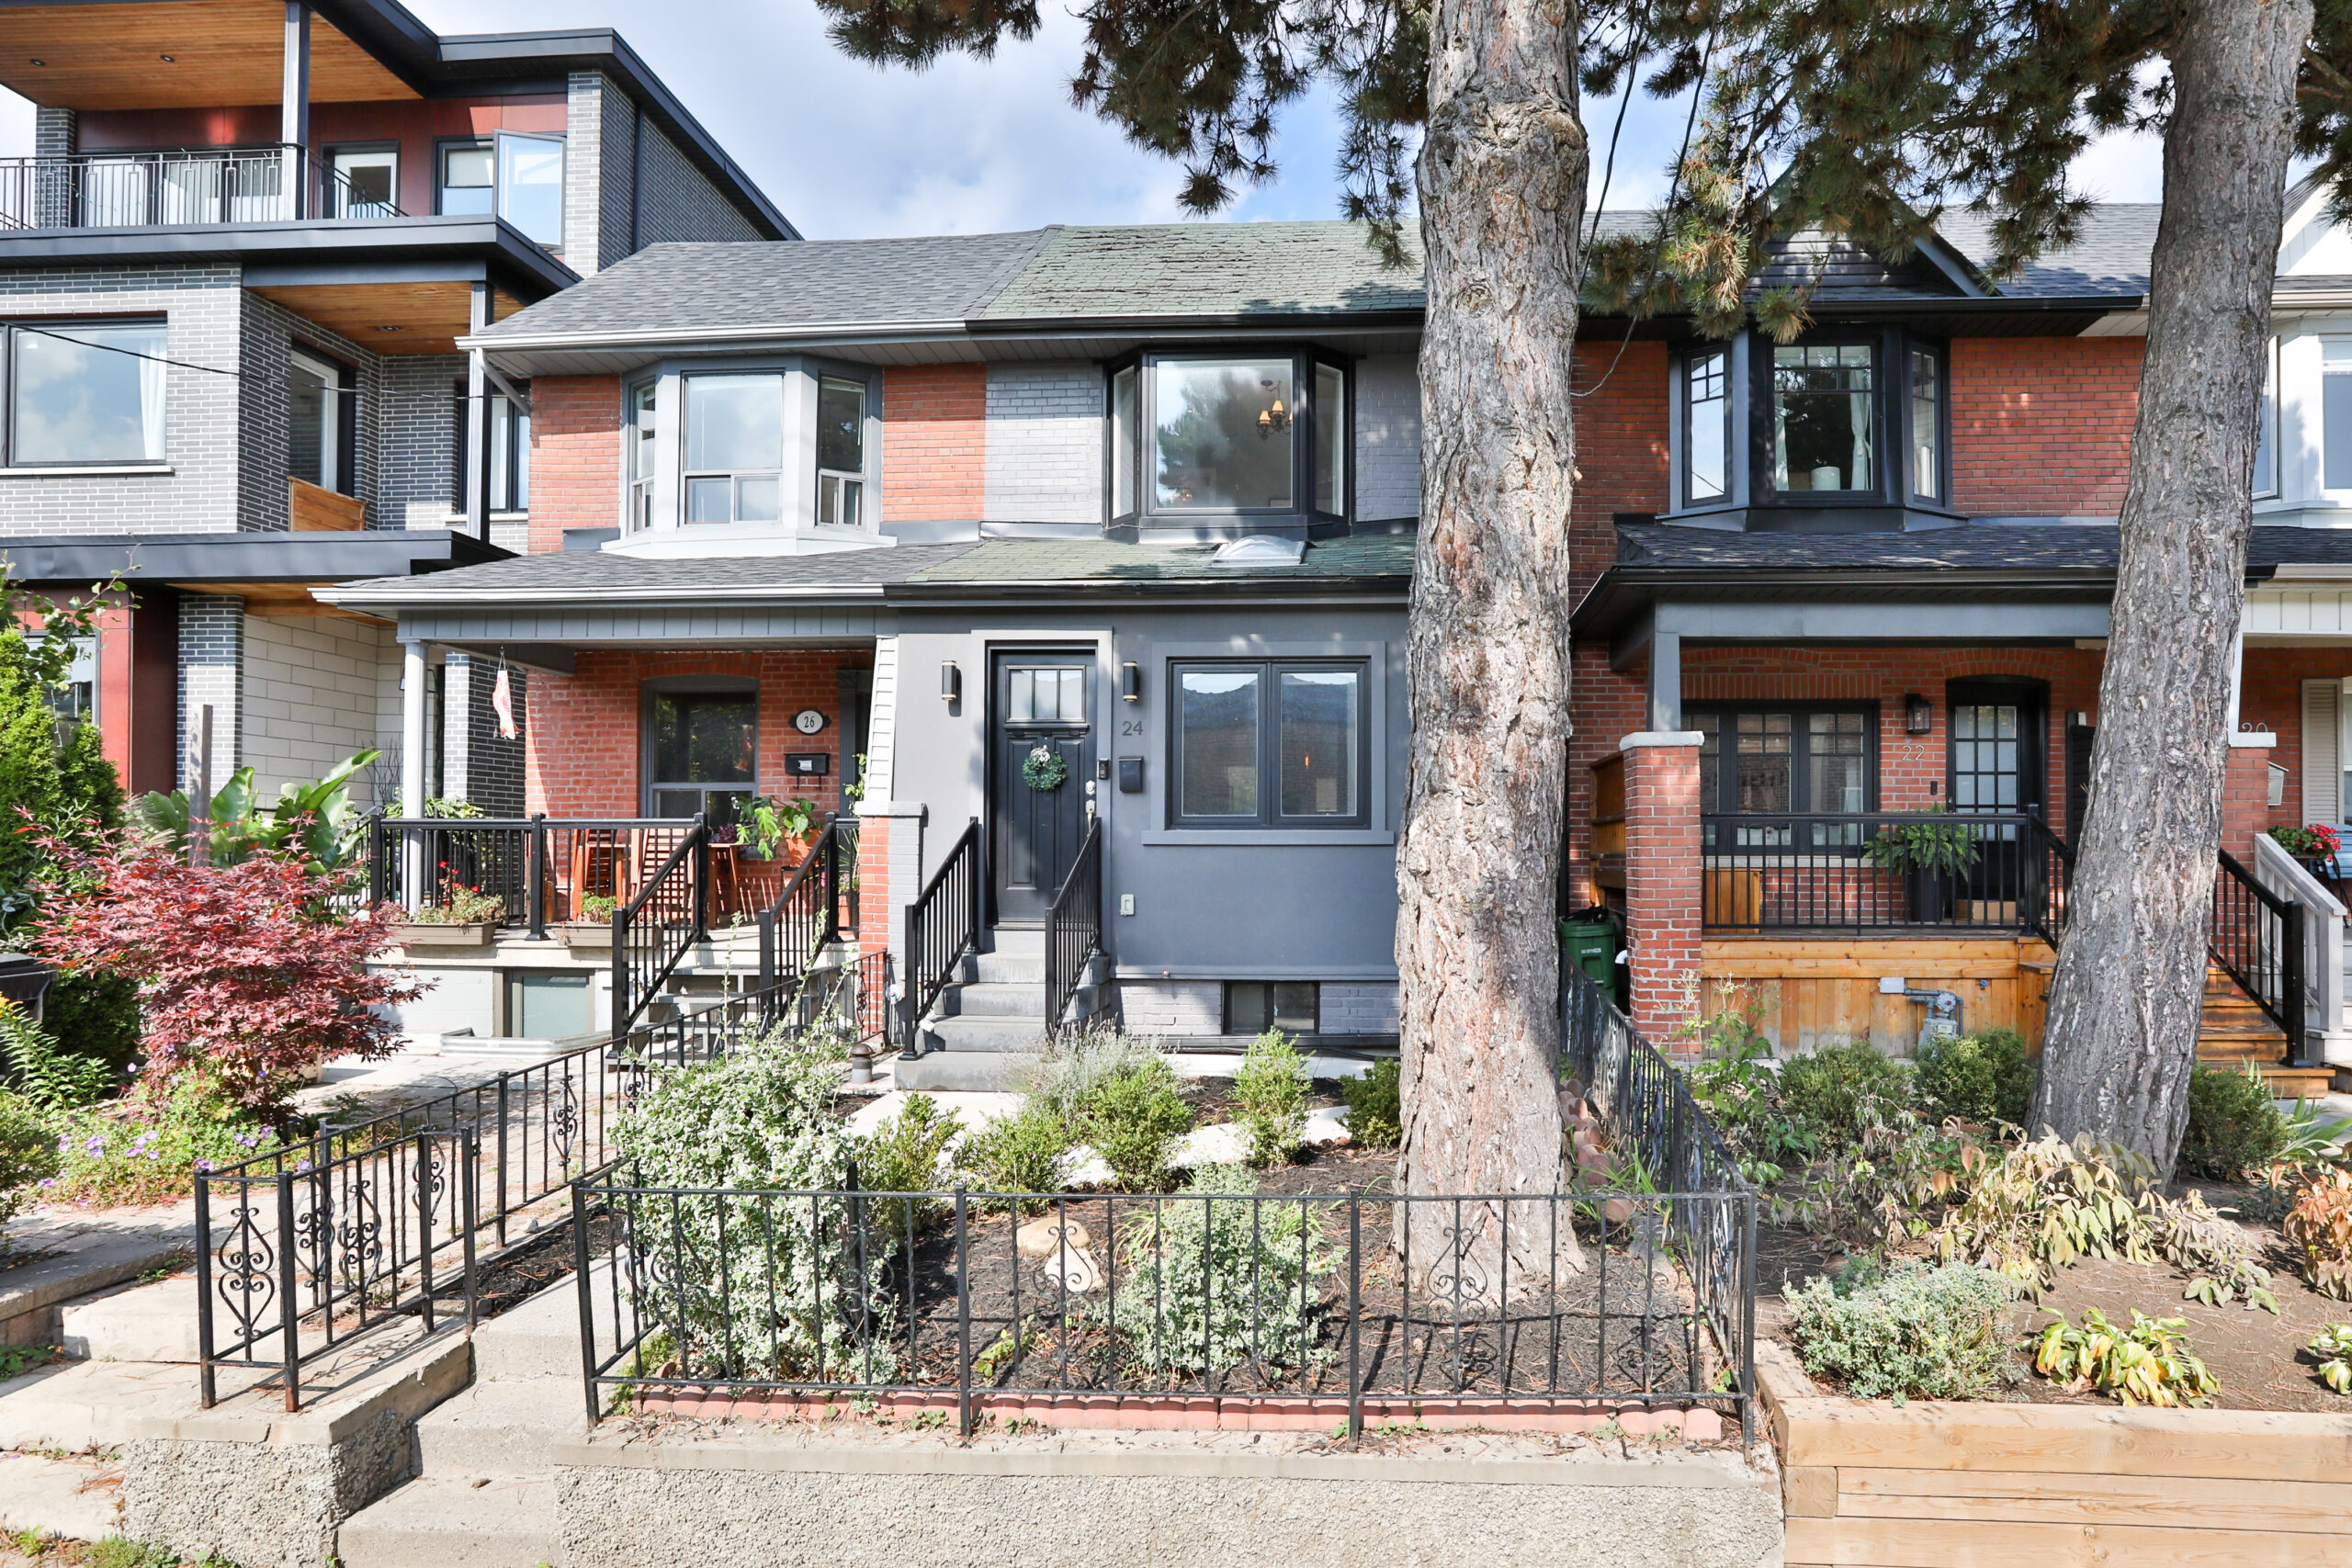
You are going to fall in love with this fully renovated 3 bedroom semi on premium Benson Ave in Wychwood! Located directly across the street from the historic Wychwood barns & park and walking distance to TTC, restaurants & shops. Stunning & bright open concept main floor with modern metal and glass railings, hardwood flooring & pot lights throughout. Gourmet chef’s kitchen with breakfast bar, built-in stainless steel appliances, quartz countertops & ample custom cabinetry. Walk-out to deck, deep garden & rear detached garage. Main floor powder room. Generous primary bedroom suite features wall-to-wall built-in closets & large south-facing bay window. 2 additional bedrooms with double closets, windows, pot lighting & hardwood flooring. Renovated 4pc family bathroom with bluetooth/LED mirror & built-in vanity for storage. The fully finished lower level features a large recreation room (23’7″ x 11’7″) with above-grade windows, pot lighting & engineered hardwood flooring. Separate area ideal for home office.
Come view everything this home has to offer in person this Saturday October 28 (2pm – 4pm)
Listed at $1,649,000
Contact me for more information or to book a private showing.
416-294-3776 (Call or Text)
braden@chestnutpark.com


If you’ve been following the Toronto real estate market, you will likely be aware of the number of key interest rate hikes that the Bank of Canada has implemented since its first rate hike on March 2, 2022. If you haven’t been paying attention to the Toronto real estate market, interest rates or the economy in general, below is an timeline of how we went from a 0.25% overnight interest rate to a 5% interest rate as well as a statement from the Bank of Canada regarding its most recent decision to hold the overnight rate at 5% for the second time in a row. It’s hard for anyone to predict 100% what the future holds in regards to rates, but many in the lending and real estate industries are suspecting that we could begin to see a decrease in the overnight rate in the second half of 2024 or potentially sooner. With that being said, it is unlikely we will see an overnight rate as low as 0.25% any time in the near future. The days of essentially free money are long gone.

The Bank of Canada released the following statement below regarding their decision to hold the overnight rate at 5% and the economy in general:
“The Bank of Canada today held its target for the overnight rate at 5%, with the Bank Rate at 5¼% and the deposit rate at 5%. The Bank is continuing its policy of quantitative tightening.
The global economy is slowing and growth is forecast to moderate further as past increases in policy rates and the recent surge in global bond yields weigh on demand. The Bank projects global GDP growth of 2.9% this year, 2.3% in 2024 and 2.6% in 2025. While this global growth outlook is little changed from the July Monetary Policy Report (MPR), the composition has shifted, with the US economy proving stronger and economic activity in China weaker than expected. Growth in the euro area has slowed further. Inflation has been easing in most economies, as supply bottlenecks resolve and weaker demand relieves price pressures. However, with underlying inflation persisting, central banks continue to be vigilant. Oil prices are higher than was assumed in July, and the war in Israel and Gaza is a new source of geopolitical uncertainty.
In Canada, there is growing evidence that past interest rate increases are dampening economic activity and relieving price pressures. Consumption has been subdued, with softer demand for housing, durable goods and many services. Weaker demand and higher borrowing costs are weighing on business investment. The surge in Canada’s population is easing labour market pressures in some sectors while adding to housing demand and consumption. In the labour market, recent job gains have been below labour force growth and job vacancies have continued to ease. However, the labour market remains on the tight side and wage pressures persist. Overall, a range of indicators suggest that supply and demand in the economy are now approaching balance.
After averaging 1% over the past year, economic growth is expected to continue to be weak for the next year before increasing in late 2024 and through 2025. The near-term weakness in growth reflects both the broadening impact of past increases in interest rates and slower foreign demand. The subsequent pickup is driven by household spending as well as stronger exports and business investment in response to improving foreign demand. Spending by governments contributes materially to growth over the forecast horizon. Overall, the Bank expects the Canadian economy to grow by 1.2% this year, 0.9% in 2024 and 2.5% in 2025.
CPI inflation has been volatile in recent months—2.8% in June, 4.0% in August, and 3.8% in September. Higher interest rates are moderating inflation in many goods that people buy on credit, and this is spreading to services. Food inflation is easing from very high rates. However, in addition to elevated mortgage interest costs, inflation in rent and other housing costs remains high. Near-term inflation expectations and corporate pricing behaviour are normalizing only gradually, and wages are still growing around 4% to 5%. The Bank’s preferred measures of core inflation show little downward momentum.
In the Bank’s October projection, CPI inflation is expected to average about 3½% through the middle of next year before gradually easing to 2% in 2025. Inflation returns to target about the same time as in the July projection, but the near-term path is higher because of energy prices and ongoing persistence in core inflation.
With clearer signs that monetary policy is moderating spending and relieving price pressures, Governing Council decided to hold the policy rate at 5% and to continue to normalize the Bank’s balance sheet. However, Governing Council is concerned that progress towards price stability is slow and inflationary risks have increased, and is prepared to raise the policy rate further if needed. Governing Council wants to see downward momentum in core inflation, and continues to be focused on the balance between demand and supply in the economy, inflation expectations, wage growth and corporate pricing behaviour. The Bank remains resolute in its commitment to restoring price stability for Canadians.
The next scheduled date for announcing the overnight rate target is December 6, 2023. The Bank will publish its next full outlook for the economy and inflation, including risks to the projection, in the MPR on January 24, 2024.”
Are you thinking of making a move or have questions about the market in general?
Contact me any time with your questions and to discuss your specific real estate plans and how I can help you.

WARMTH + CALM
Thoughtfully designed and meticulously executed!
289 Springdale Blvd! The feeling of home; warmth + calm! Thoughtfully designed and meticulously executed! This extensive renovation focuses on the function + ease of daily living with great attention to natural light + aesthetics. All completed with permits! Conveniently located on on coveted, quiet Springdale, just a short stroll from the Danforth and East Lynn Park. This solid brick detached home features an open concept main floor with gracious sized living room and dining room that opens into the spacious kitchen featuring centre island with stool seating, waterfall Quartz countertops + backsplash, pot filler, pantry and gas cooking! The main floor boasts the ever sought after powder room and mudroom space and with rear sliding door access to sunny South facing backyard.


If you’ve taken part in a Toronto multiple offer situation (“bidding war”) in the past, you can very likely relate to the frustration that many buyers feel when blindly bidding on a home while competing with other offers.
The method of listing low and holding an offer date without disclosing the details of multiples offers during a “bidding war” has played a part in driving up home prices throughout Toronto and the GTA for well over a decade. You may or may not recall, but there was once a time when properties were listed at what was perceived to be their fair market value with it being common for offers to include several conditions which we have seen less of over the recent years. However, the list low and keep everything secret method isn’t the only factor that has driven up prices, a lack of supply and a long stretch of historically low interest rates has also contributed significantly.
When buyers are not aware of how much the other parties are offering in a bidding war, they can easily spend much more than they need to in order to secure the property. In many cases, buyers have unnecessarily thrown away many thousands of dollars above the market value of a property just to get their offer accepted. In addition to the financial risks that come along with blind bidding, buyers have often only visited the property once in person for a 30-60 minute window of time, and many find themselves waiving all conditions and representations and warranties in their offers in order to compete against other offers. This can amount to the buyer taking on a significant amount of risk if there ends up being any major structural, mechanical, appliance, legal or property boundary issues relating to the property being bought.

With all of this being said, in most cases, buyers unfortunately haven’t had a choice but to participate in a multiple offer situation over the past decade as the majority of listings have been listing below market value and holding an offer date. Additionally, as stated above, the historically low rates and lack of supply hav have pretty much ensured that there would be multiple offers on the offer date.
Due to the lack of transparency in the multiple offer process, TRESA has recently implemented a new rule which, as of April 1, 2023, will allow sellers to disclose all details within an offer such as the price, deposit, closing date, conditions, etc. to all other parties who are competing for the same property should the seller direct the listing agent to disclose such information. The only information that is not permitted to be shared is personal information about each bidder, such as their names, etc.
This new rule has been implemented in hopes of introducing more transparency to the bidding process. However, it’s important to remember that buyers are not entitled to this information unless the seller directs their agent to provide such information.
At a quick glance, this news may be exciting for buyers, but an important question to consider is: will this actually make a difference if there is no upside for a seller?
Historically, a seller has always wanted to achieve the highest sale price for their home and a buyer has always wanted to secure a property for the lowest price possible, and this isn’t likely to change. If keeping the offer prices private from the bidders provides the seller with the upper hand, why would the seller want to limit their return on investment by disclosing this information?
When living in a city such as Toronto where home prices have continued to skyrocket, mainly due to a lack of supply, combined with historically low interest rates in addition to substantial and constant demand and in a city where household incomes haven’t been able to keep up with the average sale price, it’s unlikely that sellers will choose to voluntarily take a hit to their return on investment. Toronto (and Canada more broadly) are constantly growing and home prices are becoming even more unaffordable for the average Toronto citizen, so it’s likely that sellers are counting on their return on investment to assist their children with securing their very own home one day in the future, paying for university tuition or paying off other debts, among many other valid financial reasons.
Not only is it unlikely that sellers will want to voluntarily disclose the details of an offer, but based on the way the new rules are currently written at the time of this blog post, it would be logistically challenging in a multiple offer situation if a seller changes their disclosure directions in the middle of an offer presentation.

Due to the potential complexity of disclosing such details of the offers such as price, deposits, conditions, reps and warranties, closing dates, irrevocable dates and times (deadline to accept) etc, and there being no real benefit to the seller for sharing such information about the offers, it’s unlikely for listing agents to recommend disclosing this information, resulting in potentially no change to the way offer presentations take place. Unless the entire offer presentation process is re-designed (which may be possible as it’s not set in stone), we will likely continue to see the same offer presentation structure.
Although it’s completely understandable for buyers to be frustrated with the lack of transparency during a multiple offer situation, the irony is that those same buyers who may be feeling frustrated today would likely have a different outlook on the situation should they purchase a property and later be required to disclose the offer prices to potential buyers when the time comes to sell as this could potentially negatively effect their return on investment.
With all of this being said, even if more transparency isn’t created from this new optional disclosure rule, as long as buyers continue to work with experienced Toronto real estate agents who actually know the Toronto real estate market extremely well, buyers will be making market based decisions when it comes to the amount that they are willing to offer on an offer date. When preparing for an offer date, your Toronto real estate agent should be able to provide you with statistical information and an approximate market value for the home that you are bidding on so that you aren’t going in to the offer presentation blindly and so that you can pre-set your limits in regards to how much you are willing to offer.
Are you thinking about buying or selling or do you have questions about the current market?
Contact me any time with your questions or to discuss your real estate questions. I’m always happy and here to help.

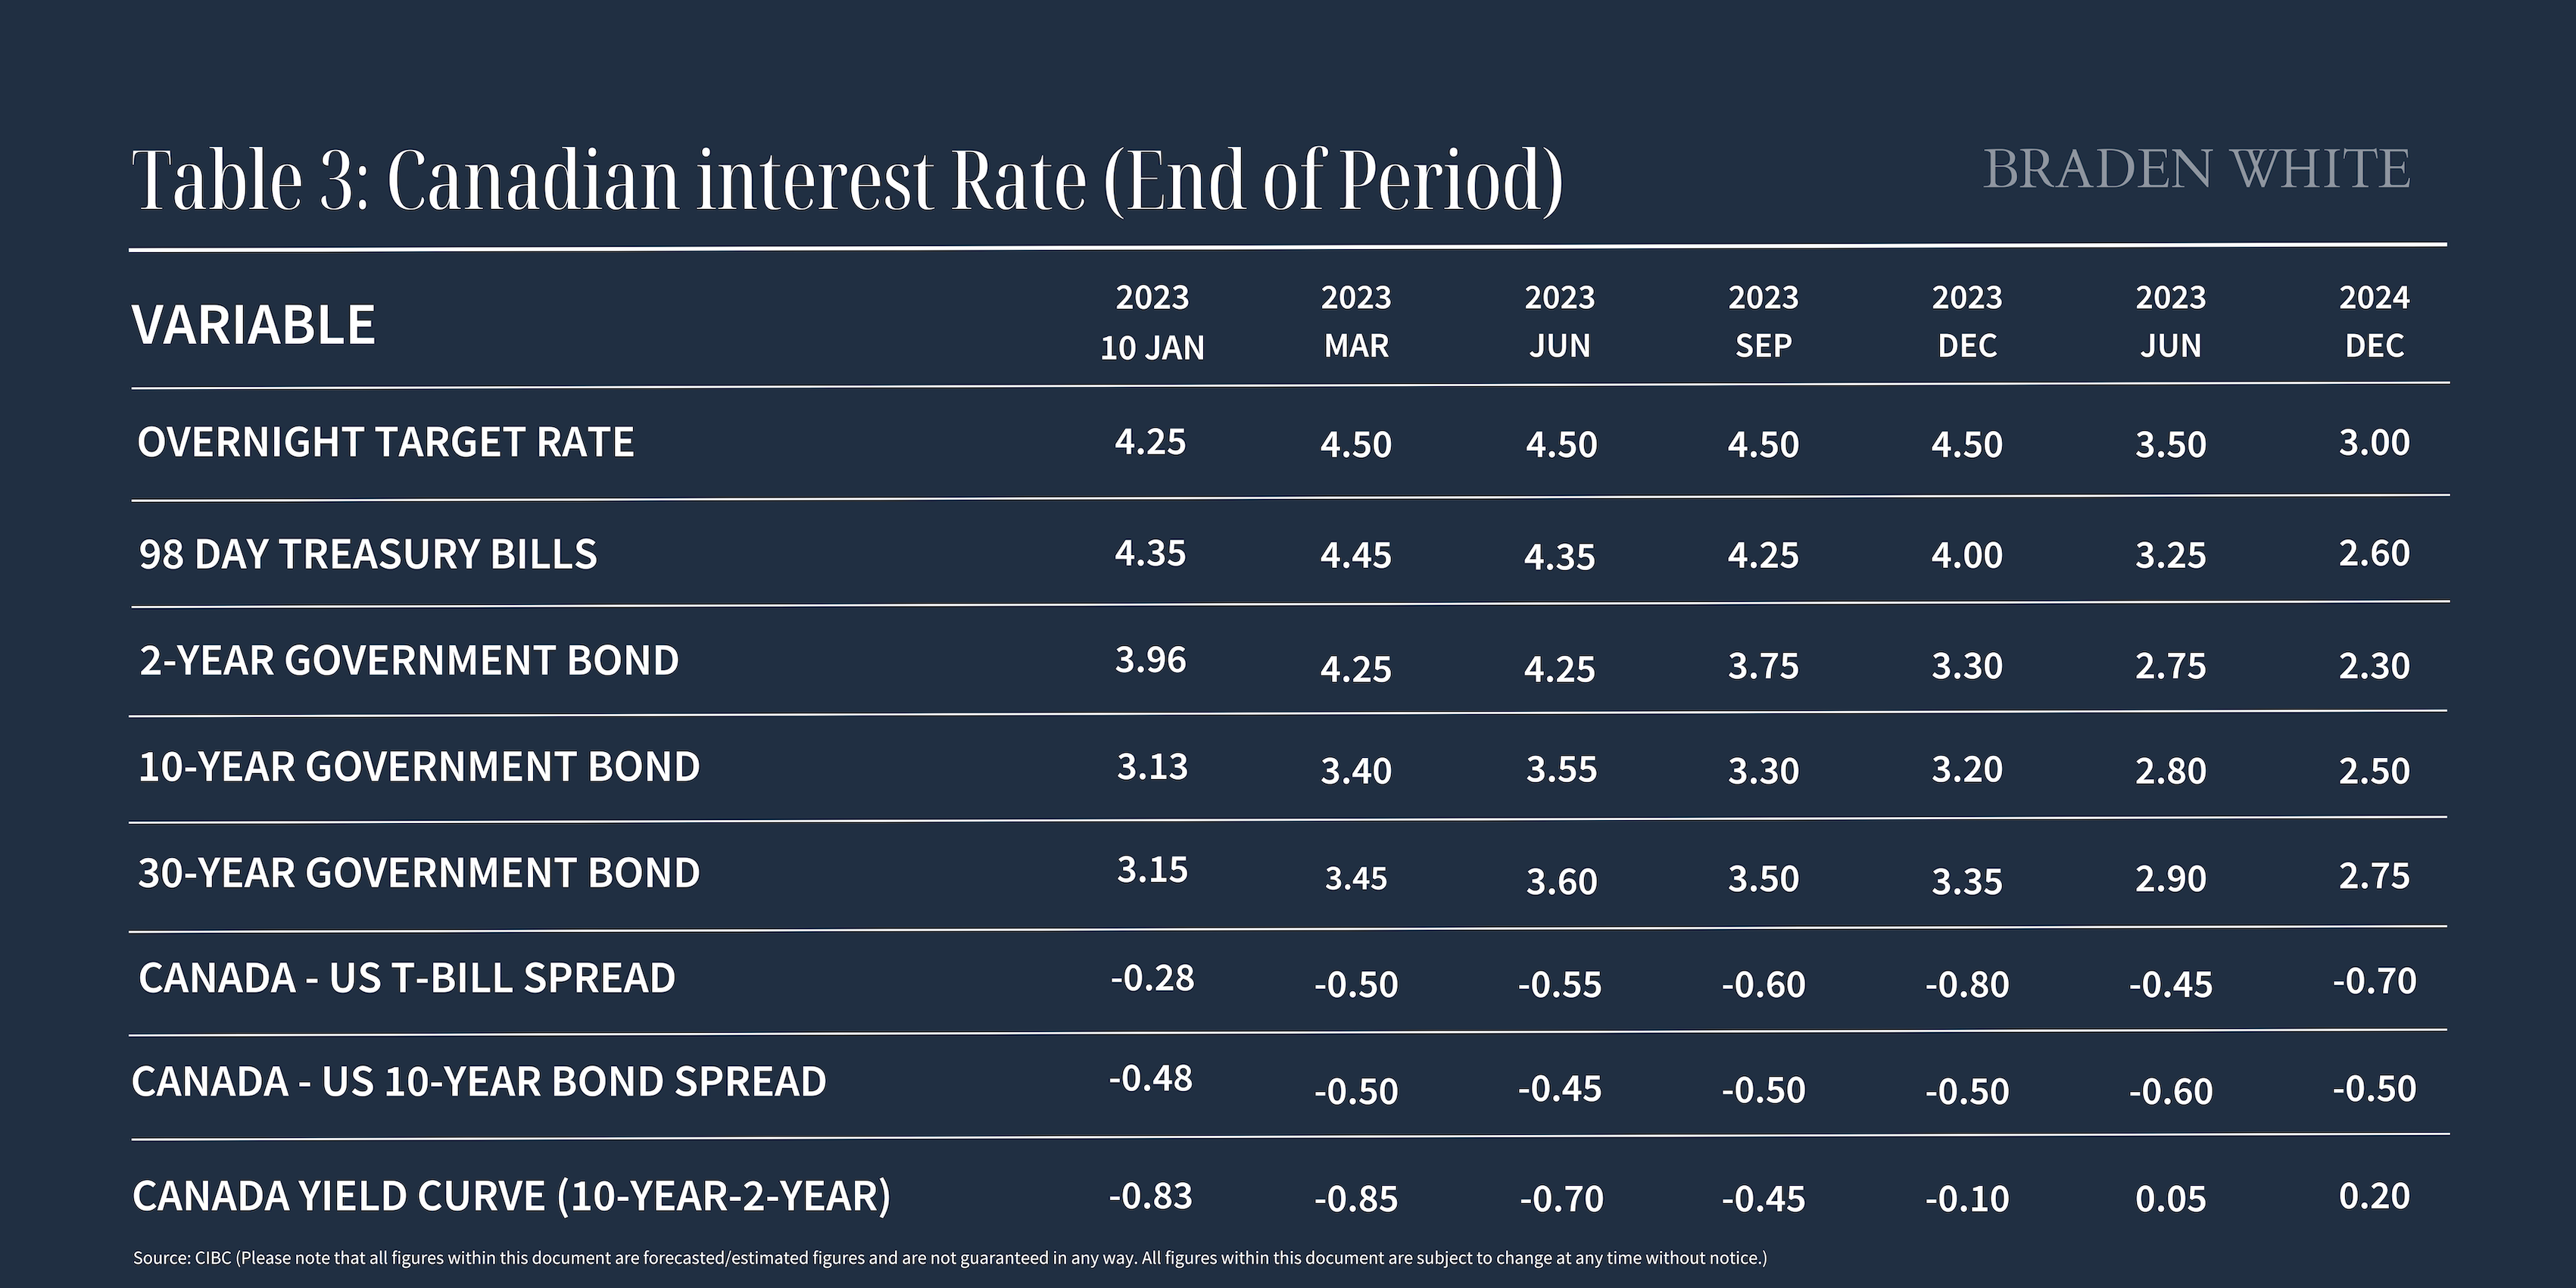
CIBC Bank recently released the following forecasted rates in the chart below. Although these figures are simply estimates, many in the financial and lending world agree that 4.5% will become the new normal key interest rate and that we likely won’t see a reduction in rates until mid to late 2024. We are unlikely to see the return of the historically low rates that we have become accustomed to over the recent years which will most definitely play a big part in Toronto’s future real estate market moving forward.
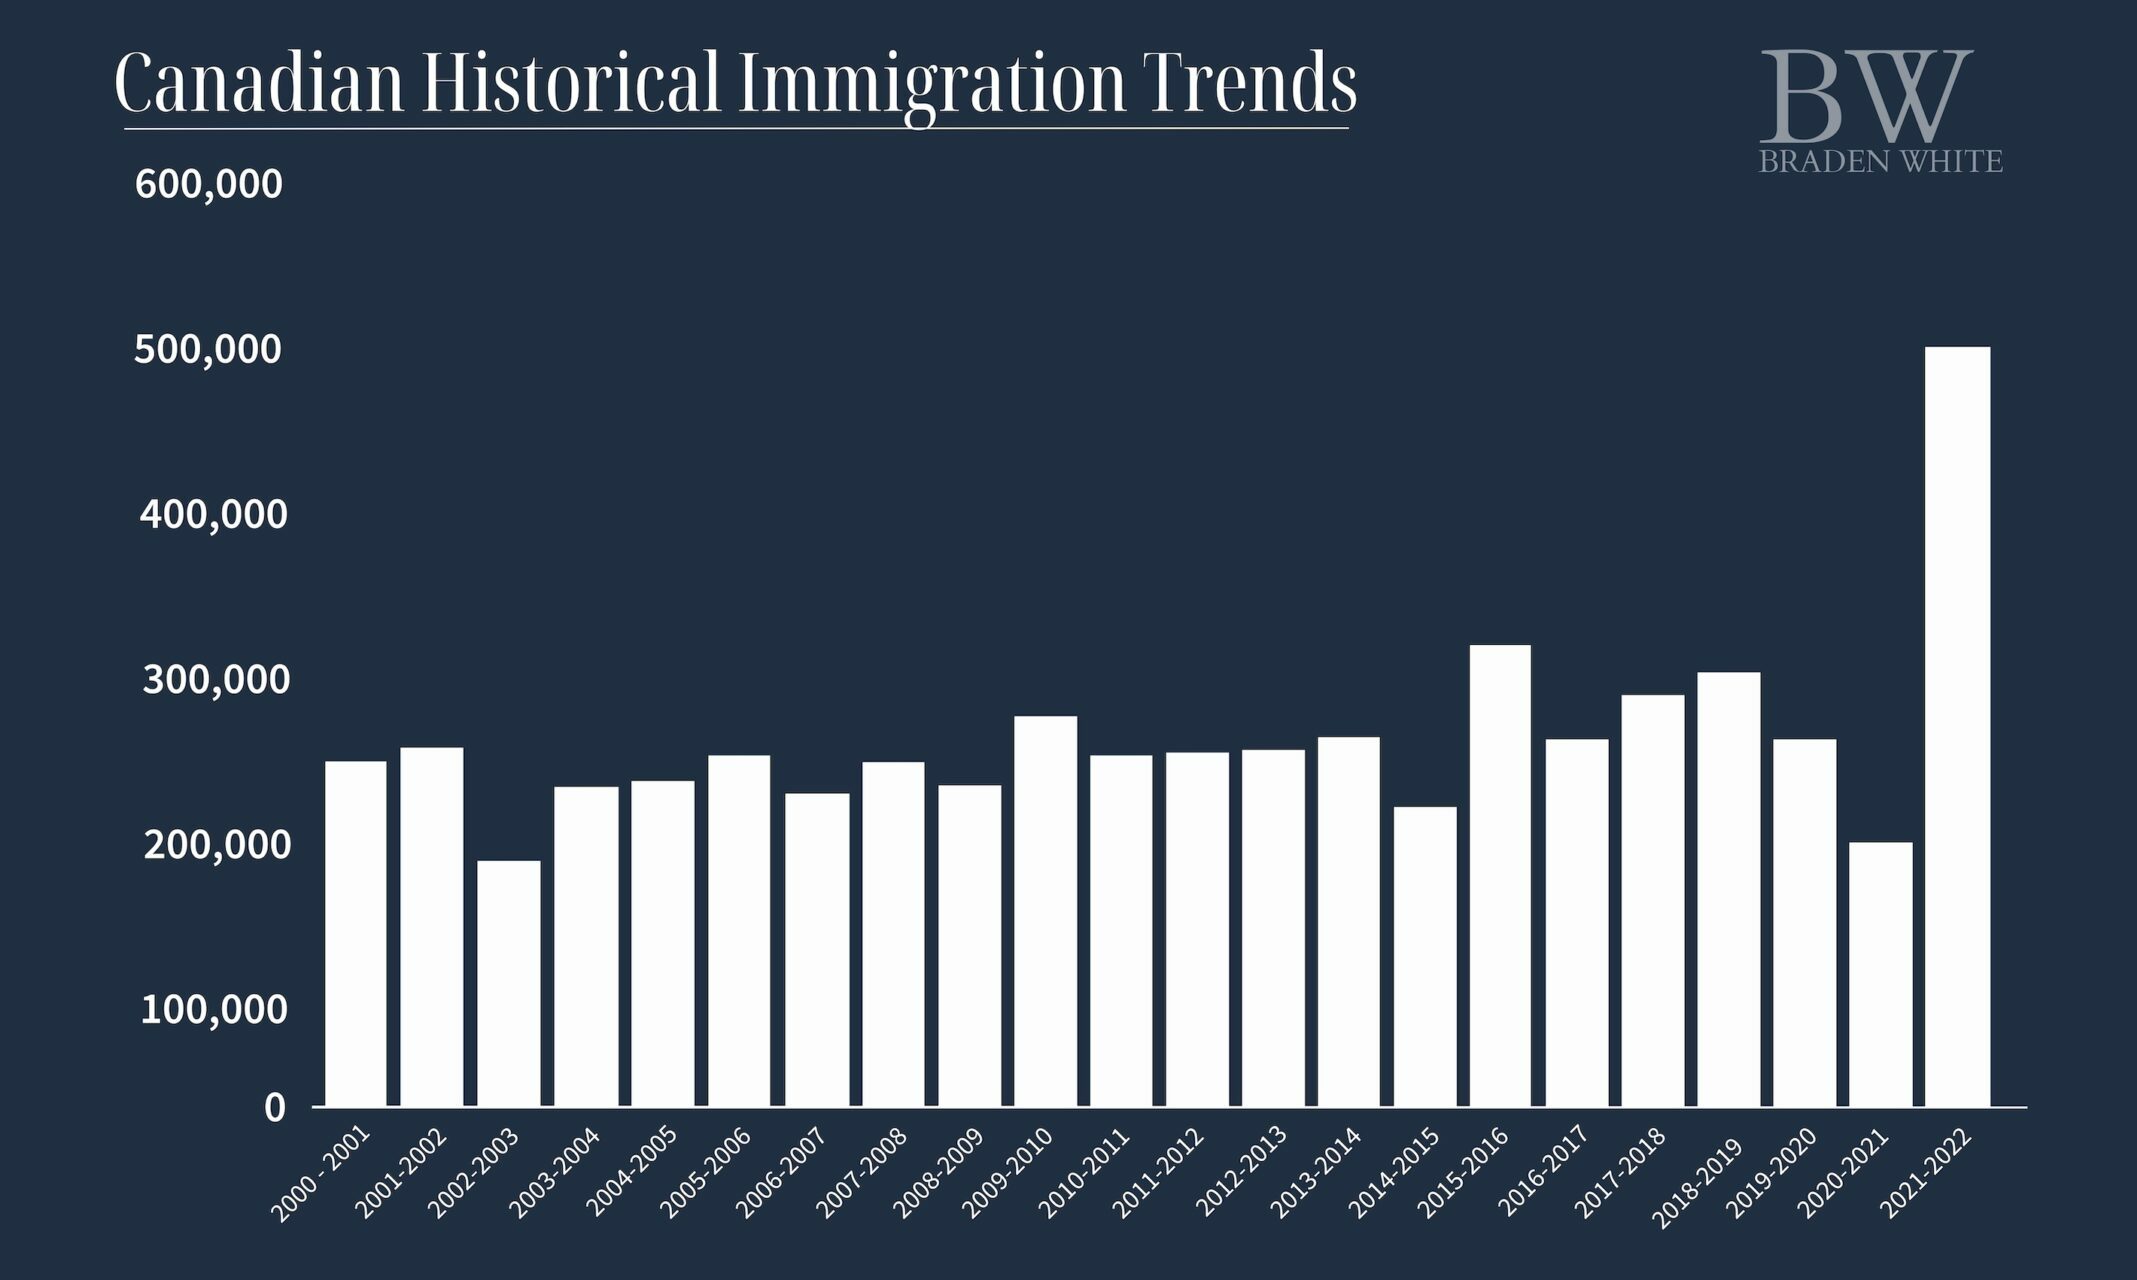
In addition to a higher key interest rate, Canada plans to admit 1.45M new immigrants over the next couple of years. Many of these new immigrants will be coming as “homebuyers” with funds to purchase a property. This large increase in population will very likely fuel an increase in the average sale price once rates have dropped in 2024. Until then it’s unlikely that we will see a drastic increase in the average sale price. Below is a chart showing Canada’s immigration trends between 2000-2022. As you can clearly see, there was a substantial growth in immigration between 2021-2022 with even more substantial growth coming over the next couple years.
With Bank of Canada’s recent announcement to stick with 4.5% as the key interest rate, many lenders are seeing an increase in buyers applying for mortgages but not as many deals taking place or closing when compared to before the rate hikes took place. Many borrowers are now borrowing money from family or using co-signers to secure their mortgages due to the limitations that the higher rates, limited household income and stress test imposes on them. The average household income in Toronto and the GTA is struggling to keep up with the higher key interest rate, growing demand for available homes and restrictions imposed by the stress test.
Are you thinking about making a move?
Contact me any time with your real estate questions or to discuss how I can help you achieve your real estate objectives. I’m here and happy to help!
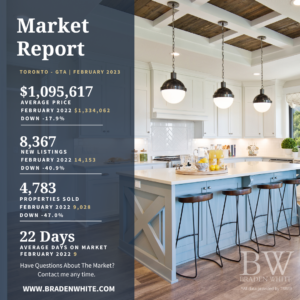
There is no point in comparing February 2023 with February 2022. February 2022 was the apogee of the pandemic residential real estate market. The average sale price achieved last February, $1,334,544, remains, and will for some time, the all time monthly average sale price record. Interest rates were at an all time low, the Bank of Canada benchmark rate was a mere 0.25 percent and is now 4.50 percent. The pandemic had created a buying hysteria, which in conjunction with low mortgage interest rates, set the stage for the most egregious example of FOMO (the emotional response to the belief that others are living better, and that important opportunities are being missed, namely buying a home in the Greater Toronto Area).
In March of last year, the Bank of Canada began its steady and continuous implementation of higher rates, and the resale market began to tumble. The months long continuous decline appears to be over, a position supported by February’s resale market data.
In February there were 4,783 properties reported sold. Viewed from a historic perspective it has been decades since a February market has produced such low volumes. Viewed from a more recent perspective these numbers are encouraging.
February’s sales results are the best month since October of last year, when the market was in free-fall.
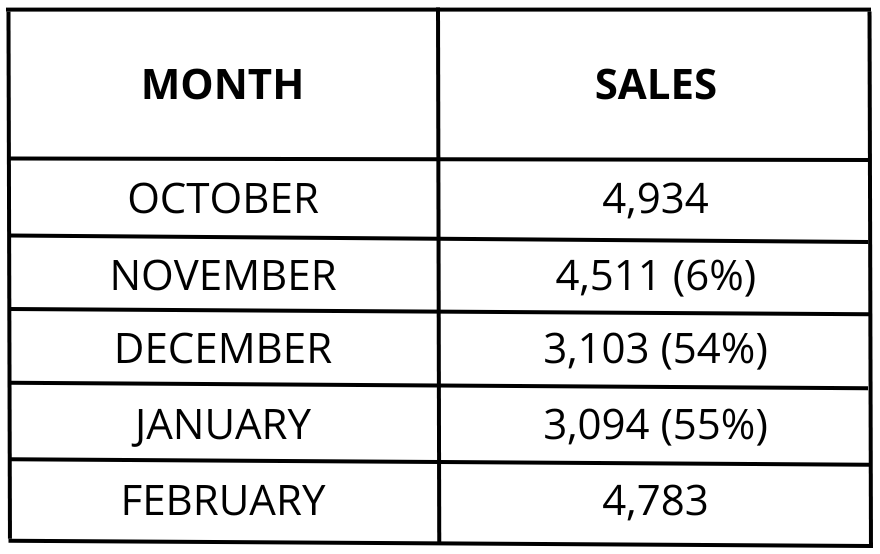
Significantly February’s performance was 6, 54 and 55 percent better than the market’s performance in November, December and January, respectively.
Similar to the volume of sales, the average sale price has also shown improvement. The monthly sale price has stabilized and is showing signs of increasing. In February the average sale price for the greater Toronto area came in at $1,095,617. In June of 2022 the average sale price had fallen to $1,145,804. Since then it has continued to fall until February’s performance.
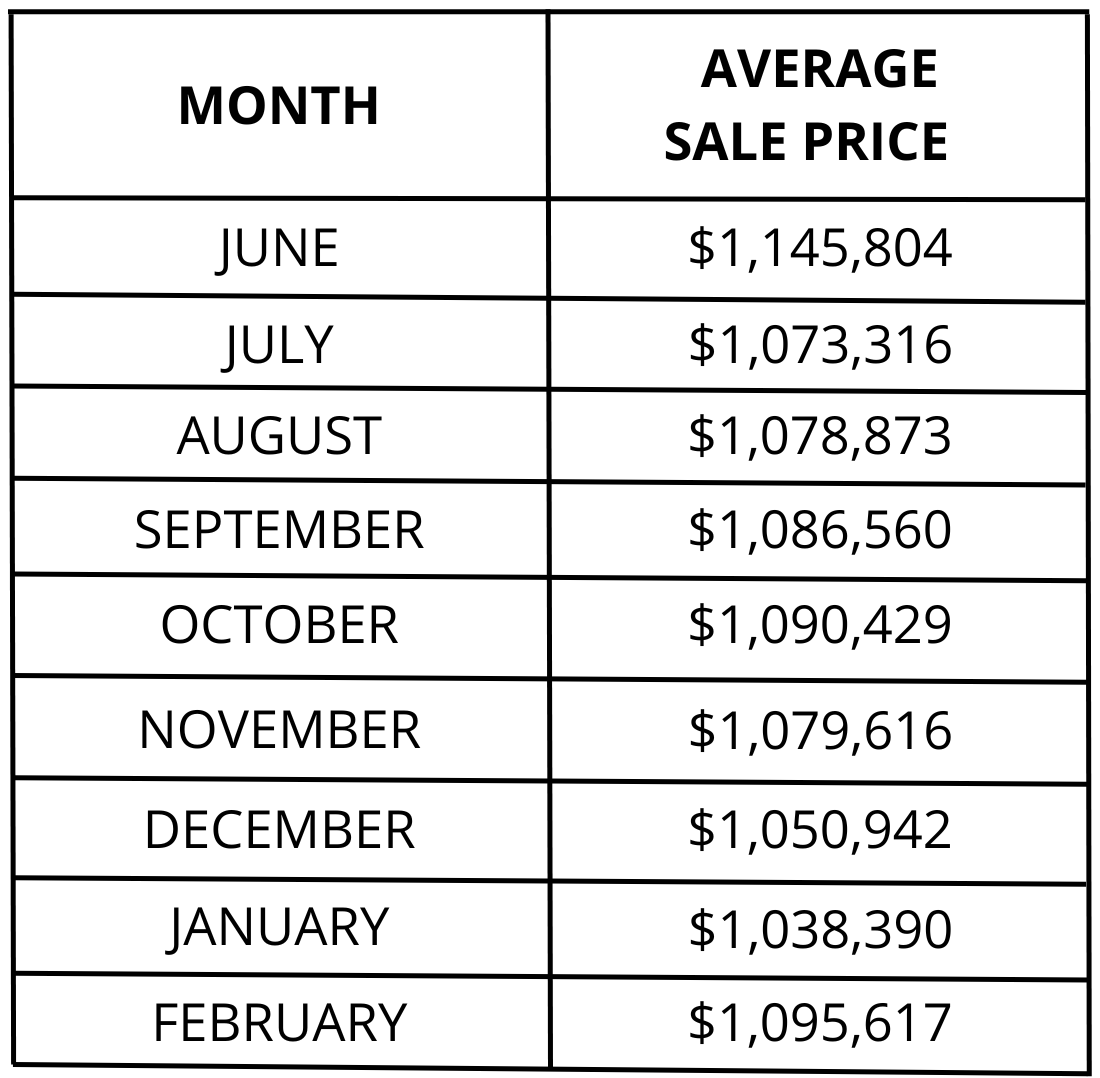
February’s average sale price was 5.5 percent higher than the average sale price achieved in January.
The reason for these positive market changes is mortgage interest stability. As the chart below indicates, a recent Bloomberg survey of economists see the Bank of Canada rate hike cycle as having peaked at 4.50 percent.
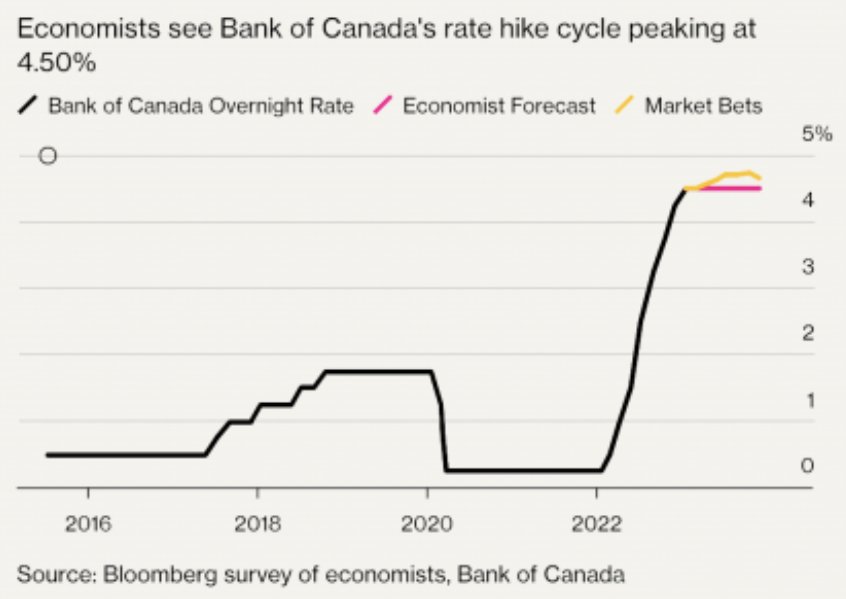
As buying history has demonstrated, once the consumer has determined that stability has been achieved the market will re-engage which is what is beginning to happen. Since the benchmark rate is not expected to decrease dramatically until at least 2024, a gently strengthening market can be expected for the remainder of 2023.

One problem that buyers will have to contend with will be supply. In February only 8,367 new properties came to market, some no doubt being re-listed properties that did not sell at their initial list price. This number is more than 40 percent fewer listings than the 14,153 that came to market last February. Although the total number of active listings was 9,643 at the end of the month, that is substantially too few to meet market demand. This speaks to two prevailing market trends. Sellers are under no pressure to sell and at least for the time being are continuing to wait for a market improvement. Given that that market improvement is now here, over the next few months the market should see more supply, which in turn will see an increase in sales volumes.
Demand is demonstrated by the length of time properties remain on market before being reported sold. In February all properties sold in only 22 days, many in multiple offer competitions. Depending on location and property type the average days on market was
substantially, in fact shockingly less – all semi-detached properties in the greater Toronto area sold in 15 days, while all semi-detached properties in Toronto’s eastern districts sold in an eye-popping 11 days, and at 106 percent of their asking price. This data indicates that the greater Toronto market, certainly on the demand side, is extremely robust, but constrained by affordability, low inventory and a slow adjustment to price expectations.
Very early March results indicate that the market’s performance is about 15 percent better than sales volumes achieved in February. If this pace continues (supply permitting with no further hikes in the benchmark rate) then March should achieve approximately 5,500 sales, if not more. That means we will see sales numbers that have not been achieved since August of 2022. The market is finally showing signs of moving in a positive direction.
Have questions about the market, selling or buying?
Contact me any time. I’m happy to answer any questions you may have.
Prepared by Chris Kapches, LLB, President and CEO, Broker, Chestnut Park® Real Estate Limited, Brokerage.

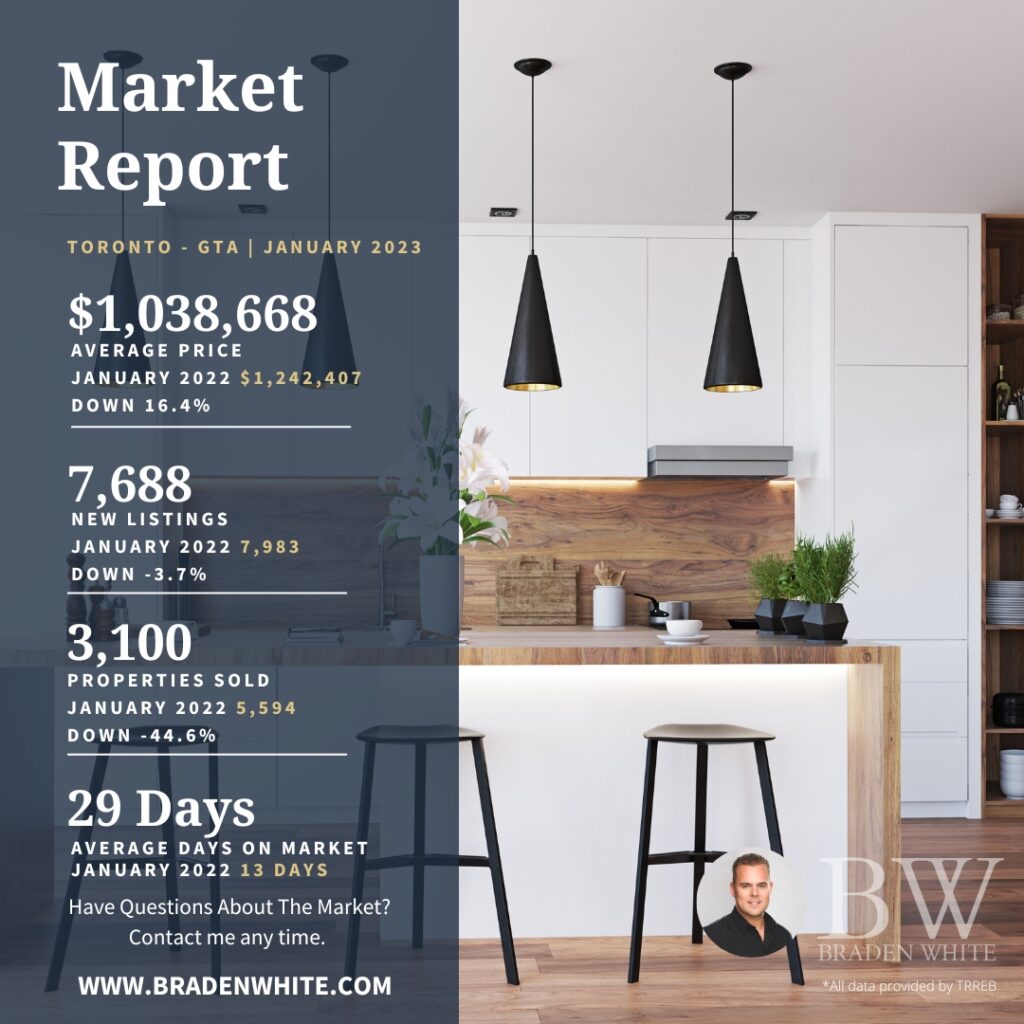
As forecast in December, the slumping resale market of 2022 continued into the first month of 2023. Compared to January 2022, sales of all property types declined by almost 45 percent. Due to the extraordinarily strong pandemic market early last year, on a year-over-year basis sales volumes will post substantial negative variances until at least April. By April 2022, increased borrowing costs had begun to slow the residential resale market with an unprecedented impact. Since March of last year, sales volumes and average sale prices have consistently declined as borrowing costs have increased.
In absolute numbers, 3,100 properties traded hands in January. Last year, 5,594 properties were reported sold. The decline, both in sales volumes and average sale prices, is universal, impacting all housing types throughout the greater Toronto Region. There were, however, variations in these declines. In the City of Toronto, sales declined by more than 46 percent and average sale prices declined by almost 15 percent. In the 905 Region average sale prices declined by almost 20 percent and sales softened by slightly over 42 percent. Sixty five (65) percent of the total sales volume (3,100 properties) took place in the 905, with the City of Toronto accounting for only 35 percent (1,098) of all sales.
The average sale price for the entire Toronto Region came in at $1,038,668, a 16.4 percent decline compared to January 2022’s average sale price of $1,242,407, which at the time, was an all-time high average sale price record. Due to the preponderance of lower-priced condominium apartment sales in the City of Toronto, the City’s average sale price came in lower at $987,000, a number reminiscent of the City of Toronto’s pre-Covid average sale price.
Although there were more properties of all types available for sale in January compared to last year, this increase was due to declining sales, not sellers flooding the market with properties for sale. Quite the contrary. At the end of January 9,299 resale properties were on the market for sale, 125 percent more than the 4,140 properties available last year. It should be noted that only 7,688 new listings came to market in January, almost 4 percent fewer than the 7,983 homes that came to market last January. With so few properties coming to market, supply, which has been the Toronto and Region’s perennial problem, will once again become a massive home-buying roadblock when sales volumes begin to improve.
Demand is still present in the market and there are signs that it is intensifying. It is being constrained only by high borrowing costs. Toronto’s much sought after eastern districts reflect the intensifying demand. Notwithstanding the prevailing high borrowing costs, all detached properties that came to market sold in 21 days – the average market average was 29 days – and at 100 percent of asking prices. Even more telling were semidetached property sales. All semi-detached properties in Toronto’s eastern districts sold in an eye-popping 18 days at sale prices 103 percent above asking prices. In fact, all semi-detached property sales throughout the City of Toronto took place in only 21 days and at 102 percent of asking.
The number of sales reported on a daily basis in the City of Toronto showed a marked increase after January 25th. On that day, the Bank of Canada announced its latest increase to be benchmark rate – 0.25 percent, taking the overall rate to 4.5 percent. More importantly, the Bank stated that its numerous rate increases since March of last year are reversing inflation and further rate increases may not be necessary. The moment potential buyers are convinced that rates are no longer increasing, the buyer inertia of the last 10 months will incrementally begin to dissipate.
Since February 2022, the average sale price in Toronto and Region has declined by more than 22 percent, to $1,038,668 in January 2023. The decline, coupled with the central Bank’s message that rates may have stabilized, with potential declines going forward, is the combination that will see the resale market reverse the course it has been on. The change, when it comes, certainly before the end of the first quarter, will see increased sales but with average sale price stability. Prices will not rise until borrowing costs decline substantially.
Have questions about the market, selling or buying?
Contact me any time. I’m happy to answer any questions you may have.
Prepared by Chris Kapches, LLB, President and CEO, Broker, Chestnut Park® Real Estate Limited, Brokerage.

The Canada Revenue Agency has taken a stance against real estate flipping with the introduction of Canada’s new anti-flipping tax which took effect January 1, 2023. This new tax seeks to curb profiteering within Canada’s housing market by taxing property sales for properties that sell within 12 months (365 days) from the date of the previous sale.

The new anti-flipping tax prohibits property owners from using the Principal Residence Exemption as a way to shelter the capital gain realized on a property that is “flipped”. For those who are unfamiliar with the Principal Residence Exemption, prior to this new tax being introduced, homeowners who sold their properties for a profit could be exempt from paying any tax on the gain (the difference between the original purchase price and sale price) so long as the property was declared as a principal residence. For clarity purposes, as of 1982, in Ontario, you are only allowed to declare one property as your principal residence. The new anti-flipping law prevents homeowners from utilizing this exemption if they sell within 12 months of buying their principal residence.
As an example, if you purchased a property for $600K and sold it for $650K six months later, prior to the new anti-flipping law, you would not be required to pay tax on the $50K gain if the property was declared as your principal residence.
In order to declare a property as your principal residence, either you, your spouse, common-law partner or child must live in the property for at some portion of the year. Properties that are purchased as an investment which generate income, such as a rental property, do not qualify as a principal residence. The income and profit generated from these investment properties are generally taxed as business income at your specific tax rate (the rate is different for each individual). The new anti-flipping law will restrict one’s ability to capitalize on quick returns resulting from market improvements and renovation investments due to the one year time restriction being enforced by the government.
Prior to the new anti-flipping law being implemented, many investors would purchase new construction properties to later sell or assign prior to or shortly after their completion in order to benefit financially from the gain realized between the time of signing and completion. Additionally, some investors would invest in traditional rehabilitation flips that consisted of purchasing a neglected home or condo, investing in improvements and then selling the home at a profit within a short period of time.

Despite the limitations this new tax introduces, some see potential benefits from Toronto’s new anti-flipping rules. By discouraging quick flips, it’s possible that more individuals and families will have more properties to choose from without having to compete with investors. This could increase the availability of housing for Toronto residents, which is a major benefit for those who are looking to buy in Toronto.
If you’re looking to buy or sell a home in Toronto, it’s important to understand the rules and regulations of Canada’s anti-flipping tax. Be sure to work with an experienced Toronto real estate agent who is familiar with the restrictions and can help you navigate the market. With their help, you’ll be better equipped to find the right property while also avoiding unexpected issues. It is also best to speak with an accountant prior to purchasing an investment property to ensure you can limit your tax liability as much as possible and avoid running into unexpected expenses.

It remains to be seen whether or not Toronto’s anti-flipping law will have a positive impact on the city’s housing market. As more buyers and sellers become aware of the new law’s provisions, it may start to have an effect on property values and availability. For now, potential buyers and sellers should be aware of this important change in order to make informed decisions about their real estate transactions.
By understanding the terms of Canada’s anti-flipping tax and working with and experienced real estate professional, buyers and sellers can make sure that their transactions comply with the legislation. With this knowledge, they can ensure that they get the best deals possible.
Are you thinking about buying or selling this year?
Contact me with any questions you may have about the market or to discuss how I can help you achieve your specific real estate objectives. I’m always happy to help.

The Toronto and area residential resale market limped to the end of 2022, a continuation of the pattern that became clear and established as interest rates began to rise in March of this year. As the Bank of Canada continued its punishing benchmark rate hikes, both sales and average sale prices have been decimated. Once again, no surprises in December.
Here is what has happened to sales since the Bank of Canada commenced its rate hikes in March.
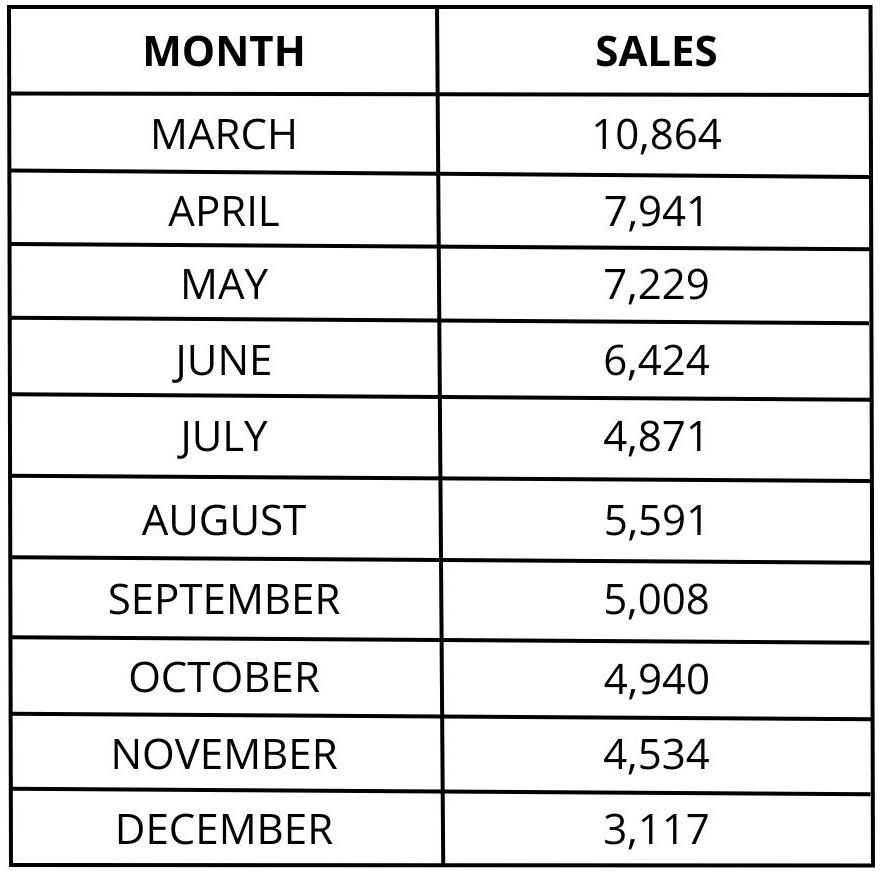
December’s sales results were more than 48 percent lower than the 6,013 properties reported sold last December. Since March the number of monthly sales has decreased by more than 70 percent. It should be noted however, December’s sales results have historically been the lowest in any year. The trajectory of average sale prices in Toronto and area has been similar to monthly sales.
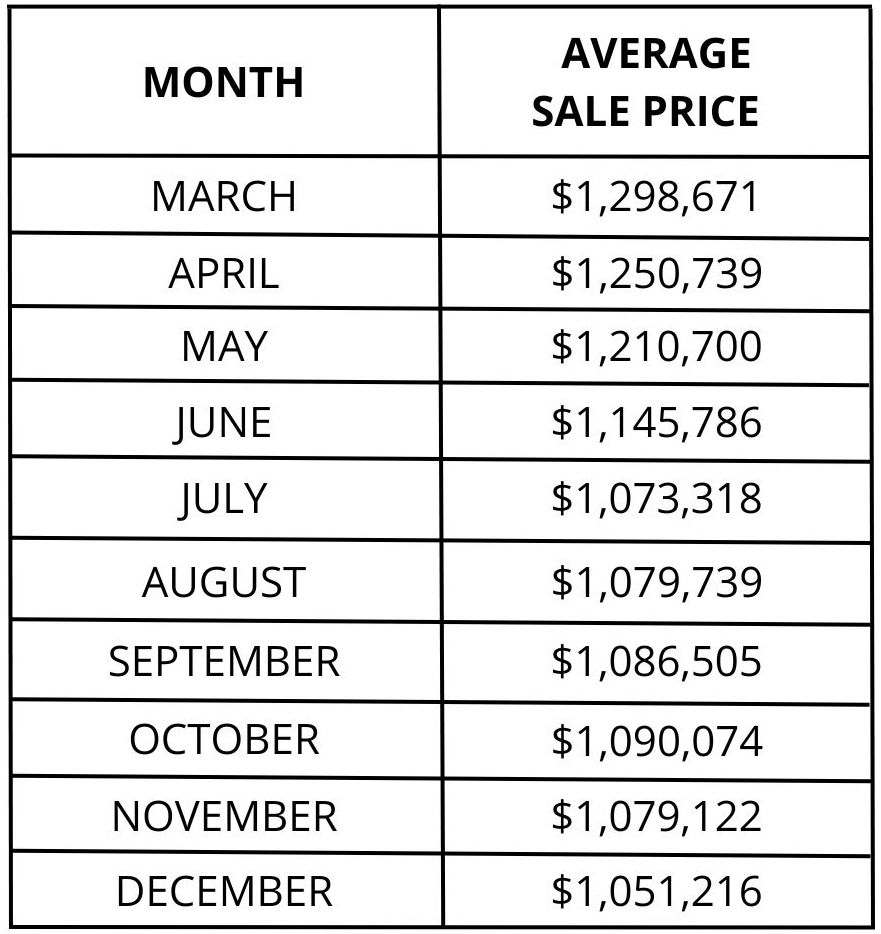
Last December the average sale price was $1,157,877. December 2022’s average sale price is almost 10 percent lower than last year. More significant is the dramatic tumble in prices since March. At the end of the year, prices are $247,455, or almost 20 percent, lower than they were in March. In the City of Toronto, primarily due to the preponderance of condominium apartment sales, the average sales price was even lower in December, coming in at $1,015,000.
The underlying driver responsible for the current marketplace is affordability. Even with a 20 percent decline in average sale prices since March, the even more accelerated rise in mortgage interest rates has made Toronto and area homes unaffordable, extremely unaffordable. A recent study by the National Bank has indicated that even with Toronto and area’s alarmingly lower average sale prices affordability is beyond the reach of all but a small number of buyers.
The National Bank reports that a mortgage on a typical home now takes up to 67.3 percent of a household’s income to service, the highest level of debt service since 1981. The Bank’s analysis indicates that to own a non-condominium home in Toronto, households need an annual income of $273,549 and many months of savings in order to have sufficient down payment funds to afford a “representative home” priced at $1,351,000. In December the average sale price for detached properties in Toronto was $1,627,000. Semi-detached properties came in at $1,162,000. For a representative condominium apartment, priced at $738,000, households need $174,466 in annual income. The average household income in Toronto in 2022 is approximately $105,000. That’s about $70,000 less than the price of a “representative” condominium apartment and almost $170,000 less than a “representative” freehold home. In December, the average sale price for condominium apartments in the City of Toronto was $741,584.
There is no good news in December’s resale data. Not only are sales and prices falling, but further declines can be expected. Unafordability has forced even would-be buyers to downscale their expectations based on their ability to qualify and then service the debt that they will be assuming. As a result, gone are the days when Toronto and area’s average selling price exceeded list prices by as much as 120 percent. In December all properties reported sold came in with a sold price of only 98 percent of the asking price. In the City of Toronto, it was lower at only 97 percent. In some trading areas, ratios were even lower. Even Toronto’s powerful eastern trading districts, which have not seen sales to list price ratios since 2008 below 100 percent came in at 99 percent.
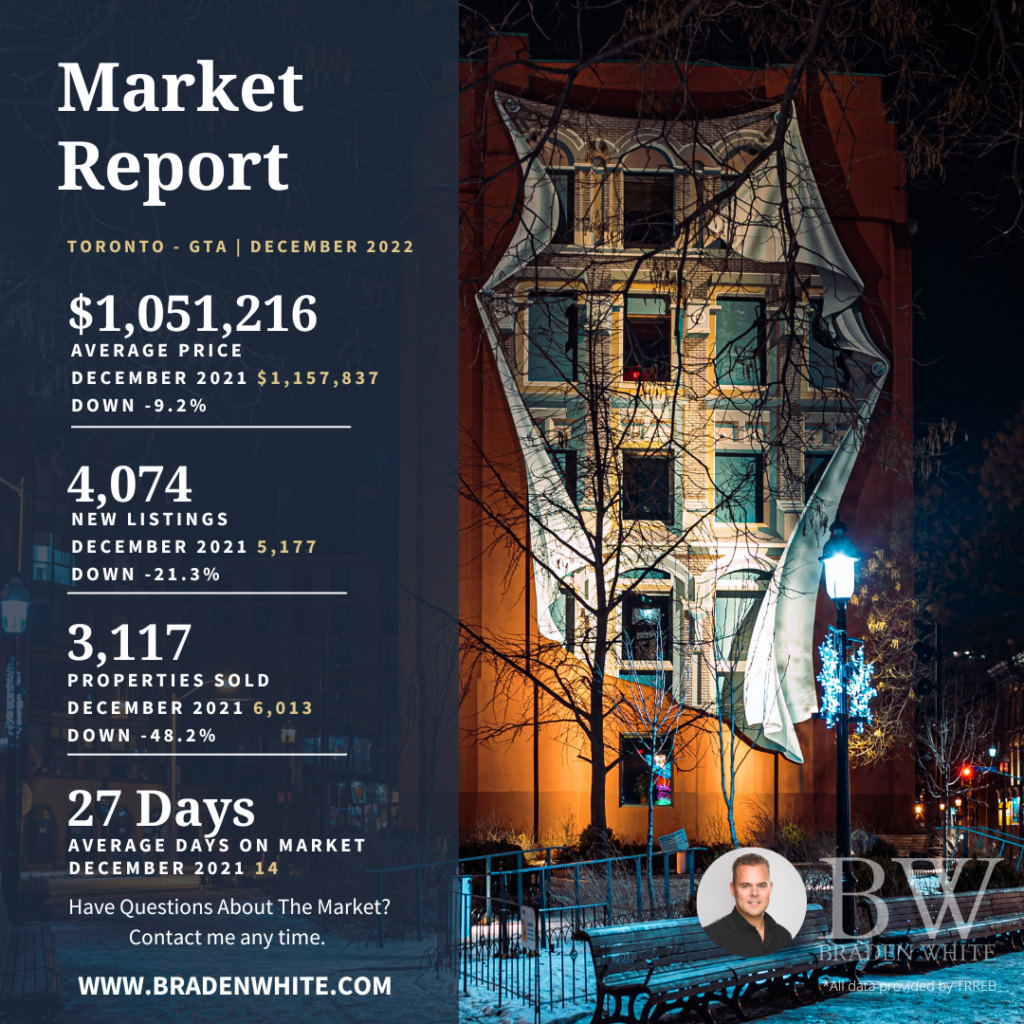
Active available properties have increased over the last few months, a common result of declining sales but not excessively. In December there were 8,692 apartments, detached, semi-detached, and townhouse available to buyers, 169 percent more than the 3,231 active listings available last December.
Even though 2022 started with three strong months, January, February, and March, the total number of annual sales was dismal. Only 75,140 properties changed hands, even less than the 78,017 sales reported in 2018 when legislative changes brought the resale market to a halt. Beyond 2018 it’s necessary to go back almost two decades to find a year when sales were as low.
Given the co-relation between mortgage interest rates, sales, average sale prices, and affordability the immediate future of the Toronto and area residential resale market is self-evident.
The market will remain sluggish well into 2023, especially since the growth in Canada’s employment numbers will lead the Bank of Canada to further benchmark rate increases. Average sale prices will continue to decline. Unfortunately, buyers are constrained by a lack of affordability given the prevailing economic factors. Buyers simply can’t pay what sellers expect (hope?) to achieve for their properties, which ultimately will have the concomitant effect of bringing prices down. There is no way of determining how low average sale prices must fall – it would be easier to forecast if the Bank of Canada’s position on rates was final – but a further 10 percent decline from December’s average sale price of $1,051,000 is a reasonable estimation. It won’t be until the beginning of the latter half of the year, and perhaps even the end of 2023, when the residential resale market begins to show signs of growth. Growth but not a return to the halcyon days of the pandemic market. The Bank rate would have to return to 0.25 percent, an impossible likelihood.
Have questions about the market, selling or buying?
Contact me any time. I’m happy to answer any questions you may have.
Prepared by Chris Kapches, LLB, President and CEO, Broker, Chestnut Park® Real Estate Limited, Brokerage.

Toronto is a city that attracts people from all over the world and it has continuously been experiencing rapid growth over the last several decades. However, in some parts of Toronto and the GTA, this growth has also come with a downside: an increasing number of vacant homes. To combat this issue and encourage owners to put their properties to use, the City of Toronto has introduced the Vacant Home Tax (VHT).
In this blog post, we’ll take a look at what the Vacant Home Tax is, how it works, and why it’s important. We’ll also discuss some potential implications of this tax and outline what you need to know if you’re an owner of a vacant home in Toronto.
What is the Vacant Home Tax?
The Vacant Home Tax is a tax levied on certain properties in the city of Toronto that are not occupied for at least six months of the year. This tax is intended to encourage owners to put their properties to use and reduce the number of vacant homes in Toronto in hopes of increasing more supply of housing throughout the city. The tax rate for each property depends on its location and the length of time it has been unoccupied.
What is the Mandatory Declaration?
All Toronto residential property owners must submit a declaration of their property’s 2022 occupancy status by February 2, 2023. You will likely have received a declaration form in the mail which you can submit to the City of Toronto or you can complete an online declaration HERE. You will need your 21-digit assessment roll number and customer number from your property tax bill or property tax account statement.
For residential properties that are not occupied by the homeowner(s), an audit may be required. If the City conducts an audit, owners may be required to submit information or documentation about tenants and/or permitted occupants to confirm occupancy during the taxation period.
It is important that you submit or complete the declaration form prior to the deadline (Feb 2, 2023) and ensure that the form is fully completed in order to avoid a fine of $250.
Residential properties will be deemed vacant if the owner fails to make the annual declaration by the deadline and/or provide supporting documentation.
How does the Vacant Home Tax work?
The Vacant Home Tax is based on a property’s assessed value, which is determined by the Municipal Property Assessment Corporation (MPAC). Owners of taxable vacant homes are required to complete an annual declaration to confirm that their property is occupied for at least 183 days of the year. If a property has been vacant for more than six months, owners must pay the vacant home tax.
Why is the Vacant Home Tax important?
The Vacant Home Tax is an important tool that can potentially help reduce the number of vacant homes in Toronto. When owners are required to pay taxes on their vacant properties, they are more likely to rent or sell the property in order for that property to be used by individuals who are in need of a residence. This can help improve the city’s housing supply and affordability.

How Is Toronto’s Vacant Home Tax Calculated?
As stated on the City of Toronto’s website:
“A Vacant Home Tax of one percent of the Current Value Assessment (CVA) will be imposed on all Toronto residences that are declared, deemed or determined vacant for more than six months during the previous year. For example, if the CVA of your property is $1,000,000, the tax amount billed would be $10,000 (1% x $1,000,000).
The tax is based on the property’s occupancy status for the previous year. For example, if the home is vacant in 2022 the tax will become payable in 2023.”
What are the Potential Implications of the Vacant Home Tax?
The Vacant Home Tax could have a number of implications for Toronto. For example, it may increase the burden on owners of vacant properties and make it more difficult for them to sell or rent out their homes. It could also lead to some homeowners attempting to game the system by underreporting the amount of time their property is occupied in order to avoid paying taxes.
How Does The Toronto Vacant Home Tax Effect Buying & Selling Toronto Real Estate?
The Vacant Home Tax has implications for property transactions, both for purchasers and vendors:
Who is Exempted From Toronto’s Vacant Home Tax?
There are some exemptions that apply to the vacant home tax. Below is a list of current exemptions which may be updated over time:
Death of a registered owner: The property was vacant for six months or more in the previous year due to the death of an owner.
The vacant property is undergoing repairs or renovations, and all the following conditions have been met:
a) occupation and normal use of the vacant property is prevented by the repairs and renovations;
b) all necessary permits have been issued for the repairs and renovations;
c) the City’s Chief Building Official is of the opinion that the repairs or renovations are being actively carried out without unnecessary delay.
Principal resident is in care: The principal resident of the vacant property is in a hospital, long term or supportive care facility for at least six months during the taxation year. This exemption may be claimed for up to two consecutive taxation years.
Transfer of legal ownership: You purchased your property in the previous year, and the sale involved a 100 per cent transfer of an interest in the property to an unrelated individual or corporation. This excludes name changes, adding a second owner and removing a second owner.
Occupancy for full-time employment: The vacant property is required for occupation for employment purposes for a total of at least six months in the taxation year, by its owner who has a principal residence outside of the Greater Toronto Area.
Court order: There is a court order in force which prohibits occupancy of the vacant property for at least six months of the taxation year.

What Owners of Vacant Homes Need to Keep in Mind
If you are an owner of a vacant home in Toronto, it is important to understand the implications of the Vacant Home Tax. Make sure that you declare your property accurately and pay taxes on time if applicable. It is also advisable to seek professional advice from a qualified accountant, real estate lawyer or the City of Toronto to ensure that you are in compliance with the rules and regulations of the Vacant Home Tax.
Make sure you understand how the Vacant Home Tax works and what your responsibilities are as an owner, so you can stay in compliance with the law and avoid costly fines.
Are you thinking of buying or selling or do you have questions about the current market? Contact me any time with your questions as I am always happy to answer them for you.